Found 56 results for "diagrams":
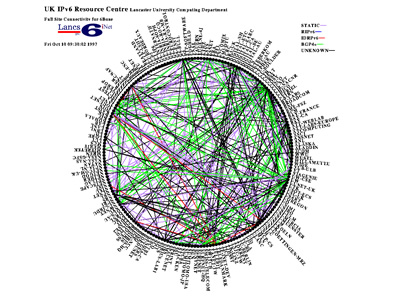 854 854 | 2005 computer graphics by (unknown) These diagrams represent the topology of all the network connections in the 6Bone, an experimental international IPv6 tested network. The first image portraits Full Site Connectivity for 6Bone in October 1997, while the second depicts the same network in October 2005. A range of 6Bone maps and diagrams tracking the global development of the 6Bone are available from the IPv6 Resource Centre website. |
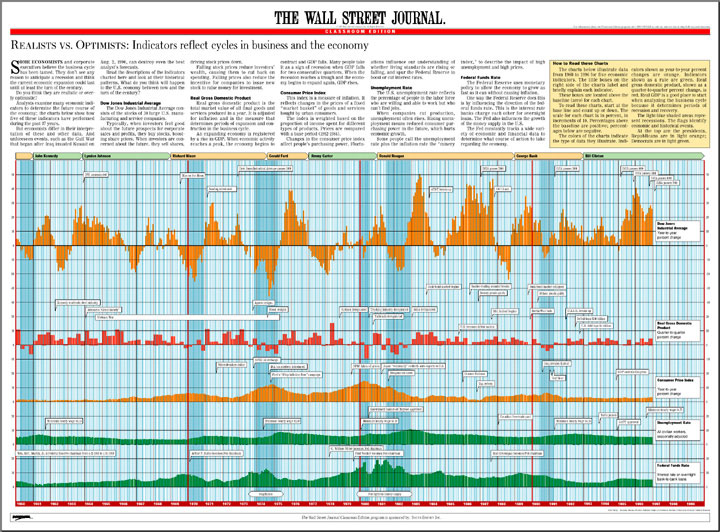 596 596 | computer graphics by Karl Hartig The charts illustrate data from 1960 to 1996 for five economic indicators reflecting cycles in business and the economy. Dow Jones Industrial Average Real Gross Domestic Product Consumer Price Index Unemployment Rate Federal Funds Rate |
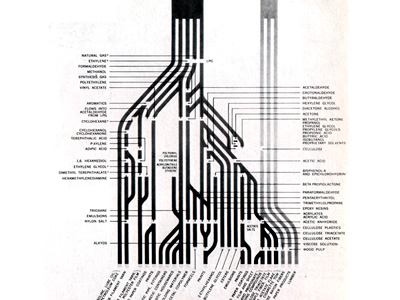 915 915 | computer graphics by Saul Bass and Associates This diagram presents a promotional brochure issued by the Celanese Corporation. It shows how the company has diversified from petroleum and cellulose into a multitude of products. Source: Herdeg, Walter. Graphis Diagrams. 4th Expanded ed. Zurich, Switzerland: Graphics Press Corp., 1981. |
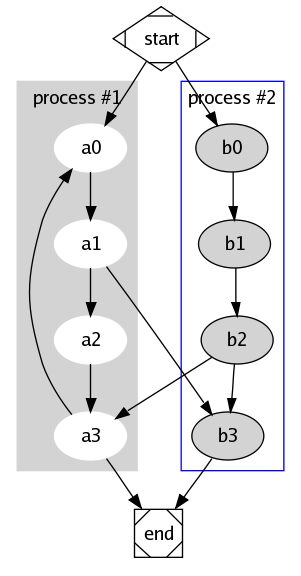 638 638 | computer graphics (Graphviz) by Graphviz - Graph Visualization Software This small example illustrates dot's feature to draw nodes and edges in clusters or separate rectangular layout regions. Clusters are encoded as subgraphs whose names have the prefix 'cluster'. The color attribute of a cluster is interpreted as its outline color or its background color if its style is 'filled'. Mdiamond and Msquare are modified symbols for data flow diagrams. |
 35 35 | 1772 print by Johann Heinrich Lambert (1728-1777), Germany Diagrams developed to represent color systems. In 1758, Mayer developed a system of constructing and naming many of the possible colours. Lambert extended this with a 3D pyramid indicating "depth" (saturation). Lambert wanted to extend the coverage of the system to include the concept of depth. He believed that the colour pyramid would be useful to textile merchants to decide if they stocked all the colours, and to dyers and printers as a source of inspiration. Lambert, J. H. (1772). Beschreibung einer mit dem Calauschen Wachse ausgemalten Farbenpyramide . Berlin: n.p. |
 36 36 | 1758 print by Johanes Tobias Mayer (1723-1762), Germany Diagrams developed to represent color systems. In 1758, Mayer developed a system of constructing and naming many of the possible colours. Lambert extended this with a 3D pyramid indicating "depth" (saturation). Mayer, J. T. (1758). De affinitate colorum commentatio , chap. Farbendreieck. n.p. Edited by Lichtenberg, 1775. |
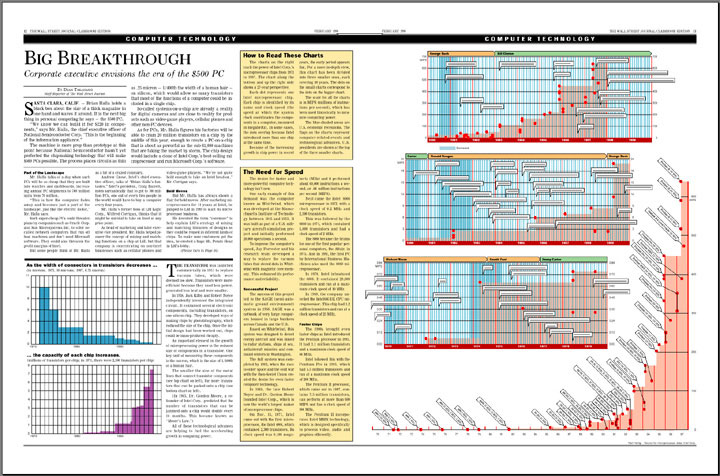 601 601 | computer graphics by Karl Hartig The charts on the right track the power of Intel Corp.'s microprocessor chips from 1971 to 1997. The chart along the bottom and up the right side shows a 27-year perspective. The scale for all the charts is in MIPS (millions of instructions per second), which has been used historically to measure computing power. |
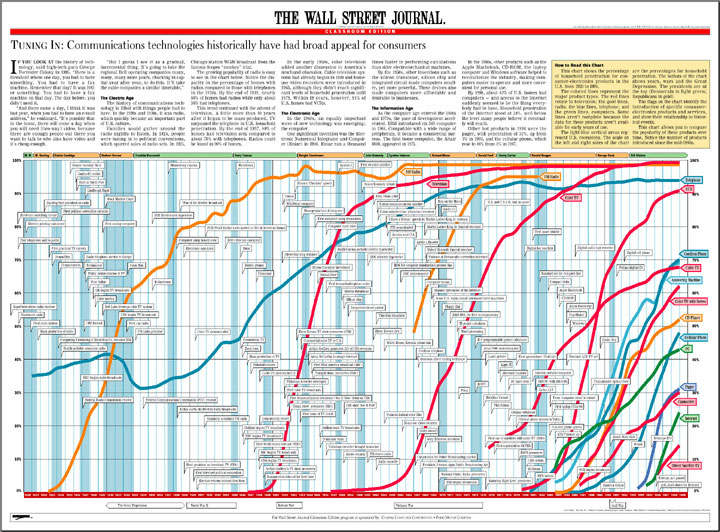 605 605 | 1998 computer graphics by Karl Hartig This chart shows the percentage of households using consumer electronics products in the U.S. from 1920 to 1998. The major product catagories are television, radio, telephone, computers. The flags identify the introduction of specific products and services, and show their relationship to historical events. |
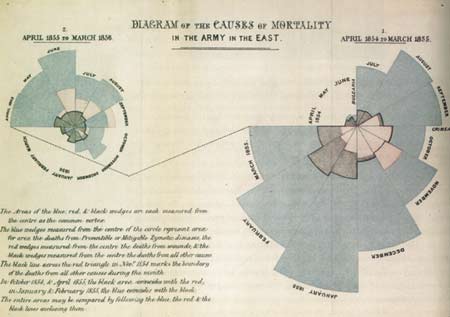 583 583 | 1857 by Florence Nightingale Florence Nightingale, a major innovator of statistical graphs and diagrams, submits her "Diagram of the Causes of Mortality in the Army in the East" as part of her Report to the Royal Commission on the Health of the Army. The diagrams demonstratethat over the course of the Crimean War, British deaths owe principally to "preventable or mitigable" diseases rather than battlefield wounds. |
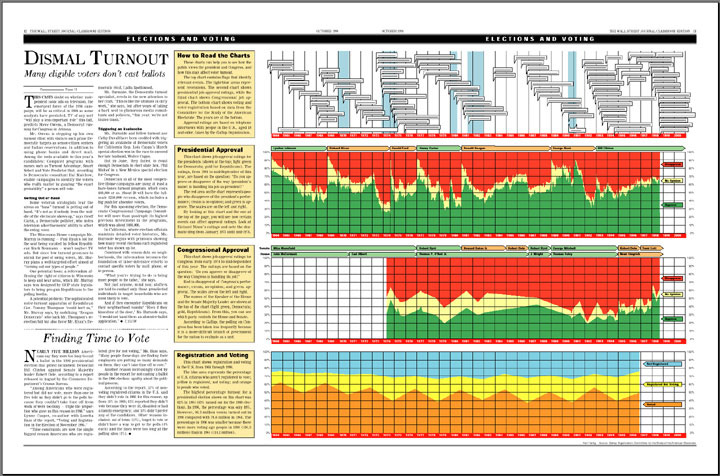 606 606 | computer graphics by Karl Hartig Charts show how the public views the president and Congress, and how this may affect voter turnout. Presidential job-approval ratings, Congressional job approval and voting and voter registration 1964 to 1998. |
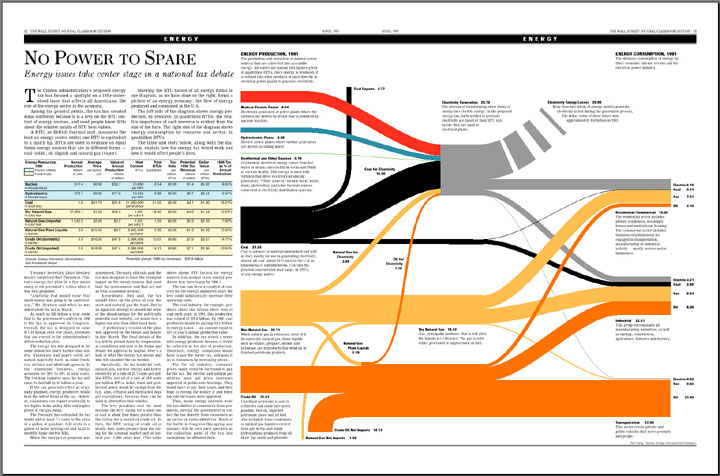 598 598 | computer graphics by Karl Hartig The left side of the diagram shows energy production, the right side shows energy consumption. All values are annual 1991 figures given in quadrillion BTUs. The gray area in the center is the generation of electricity. More than two-thirds of energy used to generate electricity is lost during the generation process. The dollar value of these losses was approximately $50 billion in 1991. |
 283 283 | 1995 computer graphics by TeleGeography Inc. Example of the statistical maps and diagrams produced by TeleGeography, Inc. This map shows European telecommunications traffic flows in 1995. [For more information see the Map of the Month article "TeleGeography's Traffic Flow Maps".] |
 57 57 | 1820 Print by Michael Faraday (1791-1867), England An increasing number of scientific publications begin to contain graphs and diagrams which describe, but do not analyze, natural phenomena (magnetic variation, weather, tides, etc.). |
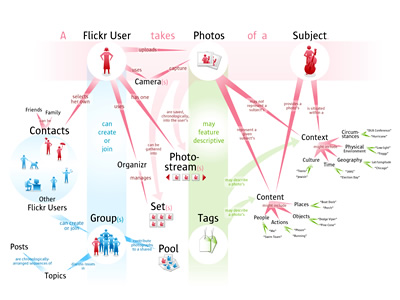 1048 1048 | 2005 computer graphics by Bryce Glass Bryce Glass has developed a series of delightful Flickr user model diagrams where one can easily understand the Flickr ecosystem and the full potential of the popular photo-sharing service. In October 24, 2005, Bryce posted this original diagram in his blog (Soldier Ant), which ended up becoming the first of a series of iterations. The latest version (v0.3) has several new elements, such as comments, rss feeds and blogs, but I still prefer the intact purity and simplicity of the original version (shown here). On his post on October 24, Bryce explains: "I've been doing some concept diagramming for work lately, and I've found myself enjoying it immensely. (...) However, since it's for work I can't share much of it. I did post some sanitized versions, with all the object-names obsfucated, but that just didn't seem wholly satisfying. So over the weekend I invested some time in a diagram that I can share with the internets: a simple Flickr user model (regrettably incomplete -- but I realized that if I tried to include the whole Flickr-verse that this diagram would go beyond labor of love and straight into excercise in folly)". To see Bryce's latest version of the diagram click here. |
 779 779 | computer graphics by kohei Sugiura Flight density during one week between international airports. From SD Magazine (Japan). Source: Herdeg, Walter. Graphis Diagrams. 4th Expanded ed. Zurich, Switzerland: Graphics Press Corp., 1981. |
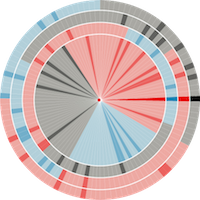
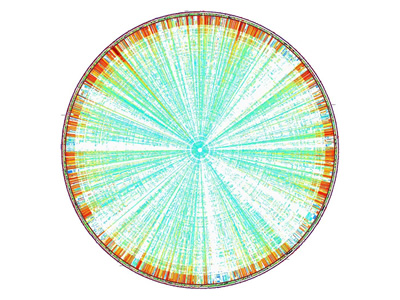 990 990 | 2004 computer graphics by Leighton Pritchard, Jennifer Whi GenomeDiagram is a Python module for drawing publication-quality images (circular and linear diagrams) of genome sequences and data at arbitrary scales (up to A0 and beyond). GenomeDiagram can take whole genome files and arbitrary data as input, displaying them on individual (or combined) tracks. The package can draw graphs of arbitrary data values, and is highly customisable. GenomeDiagram is co-authored by Leighton Pritchard and Jennifer White. Here represented is a circular diagram of Erwinia carotovora ssp. atroseptica comparison against 229 bacterial genomes, constructed using GenomeDiagram. |
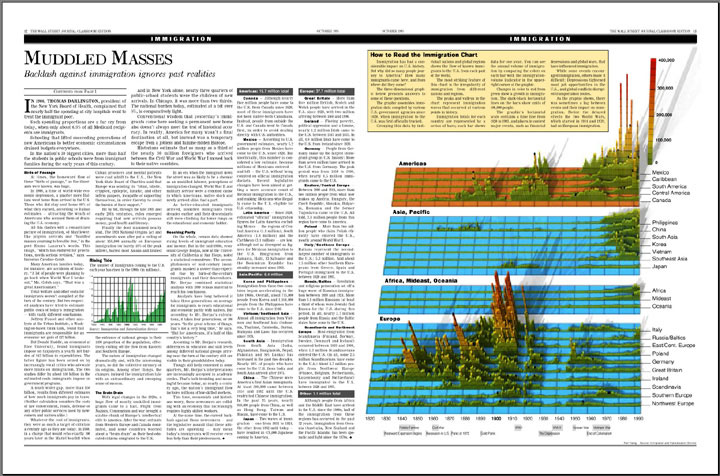 599 599 | computer graphics by Karl Hartig The three-dimensional graphic assembles immigration data compiled by various U.S. government agencies since 1820. While some events encouraged immigration, others made it difficult: Depressions tightened job opportunities in the U.S., and global conflicts disrupted transportation. |
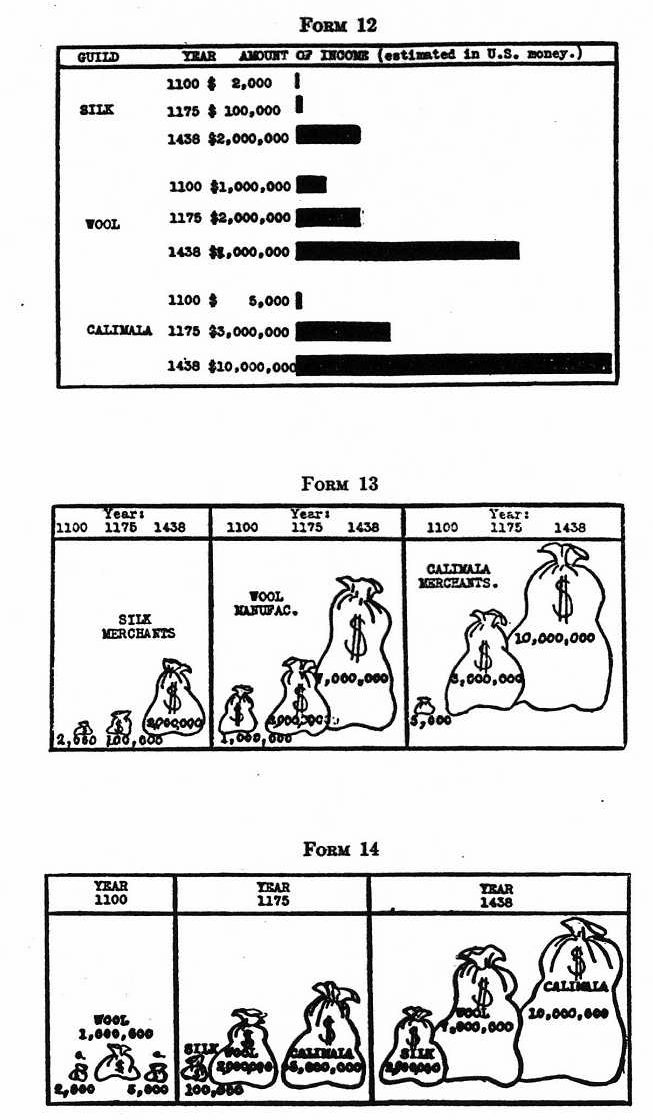 118 118 | 1927 print by J. N. Washburne, USA Spate of articles on experimental tests of statistical graphical forms: R. von Huhn, F. E. Croxton, J. N. Washburne, USA. Washburne, J. N. (1927). An experimental study of various graphic, tabular and textual methods of presenting quantitative material. Journal of Educational Psychology, 18:361-376, 465-476. von Huhn, R. (1927). A discussion of the Eells' experiment. Journal of the American Statistical Association, 22:31-36. Croxton, F. E. (1927). Further studies in the graphic use of circles and bars. Journal of the American Statistical Association, 22:36-39. Croxton, F. E. and Stein, H. (1932). Graphic comparisons by bars, squares, circles and cubes. Journal of the American Statistical Association, 27:54-60. Croxton, F. E. and Stryker, R. E. (1927). Bar charts versus circle diagrams. Journal of the American Statistical Association, 22:473-482. |
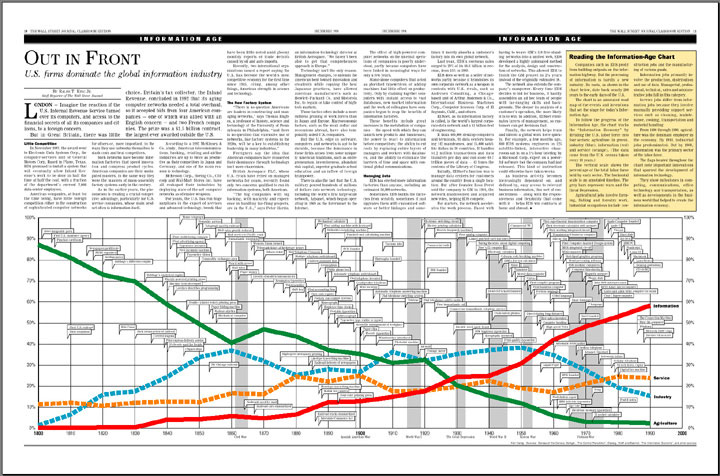 600 600 | computer graphics by Karl Hartig The chart tracks the 'Information Economy' by dividing the U.S. labor force into four sectors: agriculture (in green), industry (blue), information (red) and service (orange). The vertical scale shows the percentage of the total labor force held by each sector. From 1800 through 1900, agriculture was the dominant employer in the economy. By 1910 it was industrial jobs and by 1960, information was the primary sector of the labor force. |
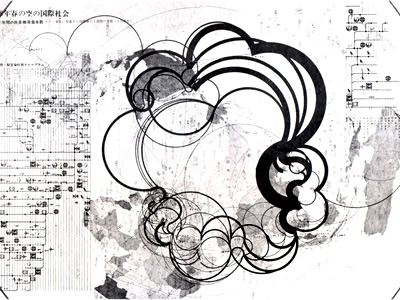
 916 916 | computer graphics by (unknown) This remarkable graph shows a travel-time map from an issue of the Japanese magazine Shukan Asahi. The shortest travel times (not counting waiting time) from Tokyo to various points around Japan using airplanes and trains were plotted in this deformed map. Data was taken from the 1969 issue of the Japan National Railways timetables. Coordinates for the various areas were determined by time coordinates using concentric circles centering on Tokyo and by topographical directions centering on Tokyo. To obtain an accurate concept of the space in this deformed map, one ought to conceive a topographical map like a prune that is all shriveled up. Source: Herdeg, Walter. Graphis Diagrams. 4th Expanded ed. Zurich, Switzerland: Graphics Press Corp., 1981. |
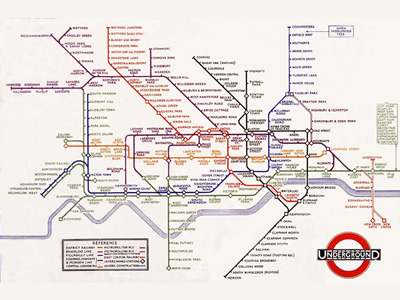 902 902 | 1933 computer graphics by Harry Beck The father of all subway maps, the London Underground map, was the brainchild of Underground electrical draughtsman, Harry Beck, who produced this imaginative yet stunningly simple design back in 1933. Beck based the map on the circuit diagrams he drew for his day job, stripping the sprawling Tube network down to basics and ignoring the exact geographical location of the tube stations. The result was an instantly clear and comprehensible chart that would become an essential guide to London - and a template for transport maps the world over. Beck's revolutionary design, with certain modifications and additions, survives to the present day and is set to serve London Underground and its millions of customers for many years to come. The first image represents Beck's original map from 1933, while the second image shows the most up-to-date version of the London Underground map. To view the map according to its accurate geographical location click here. |
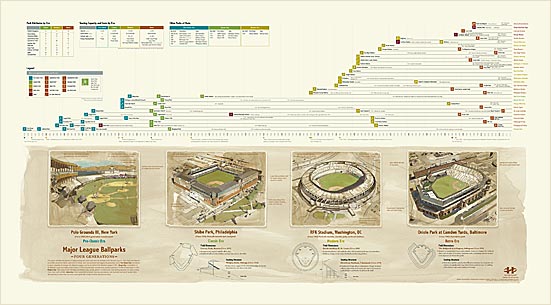 1081 1081 | print by Bill Younker and Kimberly Cloutier, White Rhino Productions This graphic describes the evolution of ballpark design and construction from the formation of the National League in 1876 through the beginning of the 2006 Major League season. It includes eighty-five ballparks profiled across four distinct generations of design including: * Pre-Classic (1870s - 1900s) * Classic (1900s - 1950s) * Modern (1950s - 1990s) * Retro (1990s to present day) The graphic includes four illustrations, each approximately 6 by 5 inches, commissioned by HistoryShots. In addition, the print contains summary tables, a diagram that maps the four waves of ballpark construction, a timeline delinating key events that triggered each wave of construction, illustrations of the first park for each generation and diagrams of field dimensions and seating structures. Ballparks is printed on Monadnock Dulcet 80# Cover, a high-quality, fine art, acid-free archival paper using a Heidelberg offset press. In addition to the four-color printing process, each print is sealed with aqueous-satin coating to provide longevity. Credits Concept, research, and data: Bill Younker Design: Bill Younker and Kimberly Cloutier, White Rhino Productions Illustrations of Polo Grounds III, Shibe Park, RFK Stadium and Oriole Park at Camden Yards: David Reinbold Section Diagrams of Wrigley Field and Riverfront Stadium: Courtesy of Philip Bess |
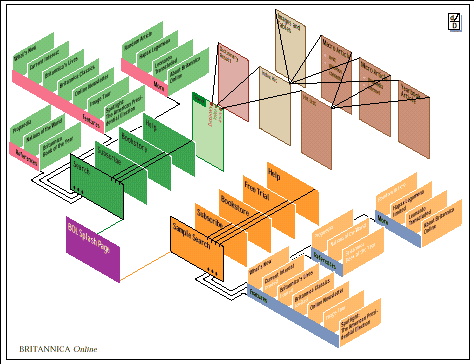 510 510 | computer graphics by Dynamic Diagrams Inc. Dynamic Diagrams Inc. are a leading company in designing web site maps and navigation tools. One of the graphic styles they use is to maps sites in a perspective view, with individual web pages sticking up, a bit like a card index. A good example of these is shown below, a map of Britannica Online. Dynamic Diagrams have a Java product called MAPA, which produces interactive web site maps. Two example MAPA web site maps are shown below, one for part of IBM Corporation's web site and the other for part of Dynamic Diagrams's own web site. |
 517 517 | computer graphics by Dynamic Diagrams, Inc. Dynamic Diagrams Inc. are a leading company in designing web site maps and navigation tools. One of the graphic styles they use is to maps sites in a perspective view, with individual web pages sticking up, a bit like a card index. A good example of these is shown below, a map of Britannica Online. Dynamic Diagrams have a Java product called MAPA, which produces interactive web site maps. Two example MAPA web site maps are shown below, one for part of IBM Corporation's web site and the other for part of Dynamic Diagrams's own web site. [For more information see the Map of the Month article "Web Site Maps from Dynamic Diagrams" in Mappa.Mundi Magazine.] |
 518 518 | computer graphics by Dynamic Diagrams, Inc. Dynamic Diagrams Inc. are a leading company in designing web site maps and navigation tools. One of the graphic styles they use is to maps sites in a perspective view, with individual web pages sticking up, a bit like a card index. A good example of these is shown below, a map of Britannica Online. Dynamic Diagrams have a Java product called MAPA, which produces interactive web site maps. Two example MAPA web site maps are shown below, one for part of IBM Corporation's web site and the other for part of Dynamic Diagrams's own web site. [For more information see the Map of the Month article "Web Site Maps from Dynamic Diagrams" in Mappa.Mundi Magazine.] |
 735 735 | computer graphics by Mark Lombardi "Mark Lombardi (1951-2000) draws on the major political and financial scandals of the day to create large-scale linear diagrams that at first glance look like celestial maps; a closer reading reveals the intricate web of connections that lurk beneath current headlines. From Whitewater to the Vatican Bank, Lombardi uses dotted lines and broken arrows to chart the paths of illicit deals and laundered money, keeping track of it all in a handwritten database of 12,000 index cards. By scrutinizing the mutable boundaries that separate artistic practice from daily life, Lombardi wrings visual poetry out of dirty secrets--the results are a chillingly beautiful guide to the facts of life." |
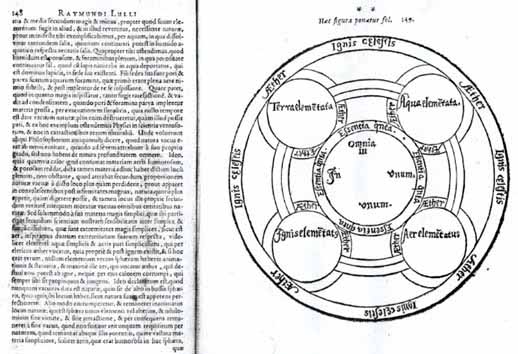 3 3 | 1235 print by Ramon Llull (1235-1316), Spain Mechanical diagrams of knowledge, as aids to reasoning (served as an inspiration to Leibnitz in the development of symbolic logic) (Spain). |
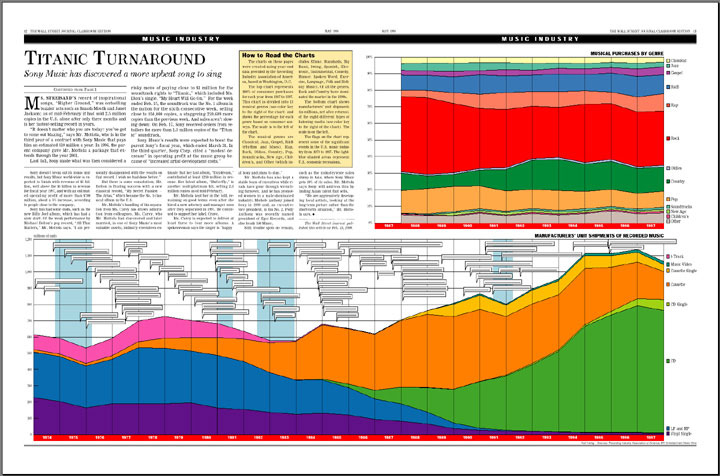 602 602 | computer graphics by Karl Hartig The top chart shows consumer purchases by type of music from 1987 to 1997. More than a third of the music sold is Rock (red). The bottom chart shows consumer purchases by type of media from 1973 to 1997. Notice the switch from cassettes (orange) to CDs (green). |
 1234 1234 | 2006 computer graphics by Arno Klein and Nadia Ries-Shen (PIIM) Networks can be represented in many different forms, each of which may be projected into different mathematical spaces for analysis. Node-link diagrams can expose network vulnerabilities, highlight optimal paths, and cluster nodes for analysis. Radial formats provide alternate ways of layering, integrating, and navigating networks. Quantitative icons can help to explore the dynamics of interacting subnetworks. |
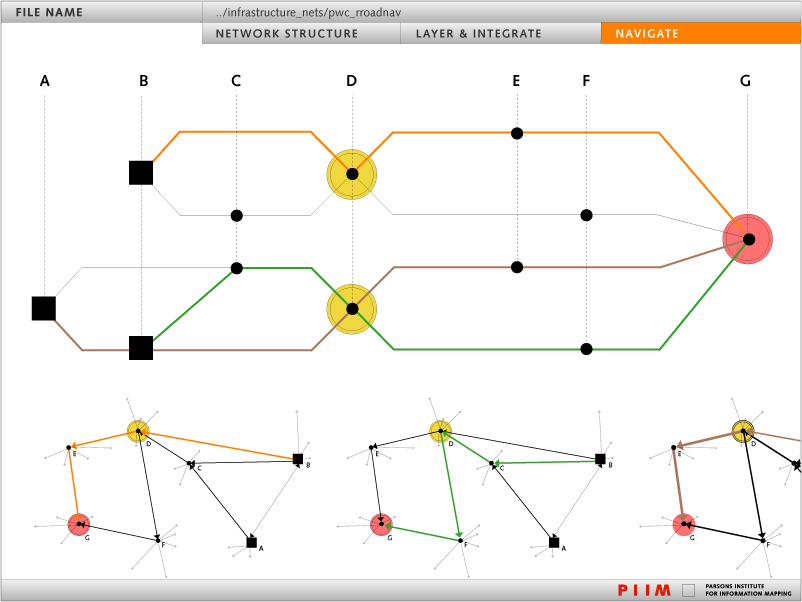
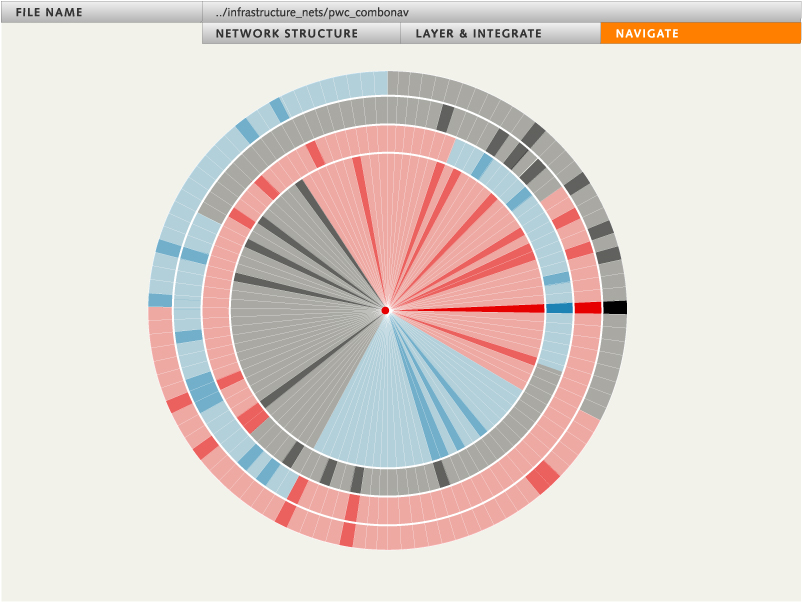 1232 1232 | 2006 computer graphics by Arno Klein and Sayoko Yoshida (PIIM) Radial formats provide alternate ways of layering, integrating, and navigating networks. This “combination lock†approach to decision making uses stepwise combinatorics to selectively navigate a solution space. Other network representations include more conventional node-link diagrams that can expose network vulnerabilities, highlight optimal paths, and cluster nodes for analysis, and even quantitative icons that can help to explore the dynamics of interacting subnetworks. |
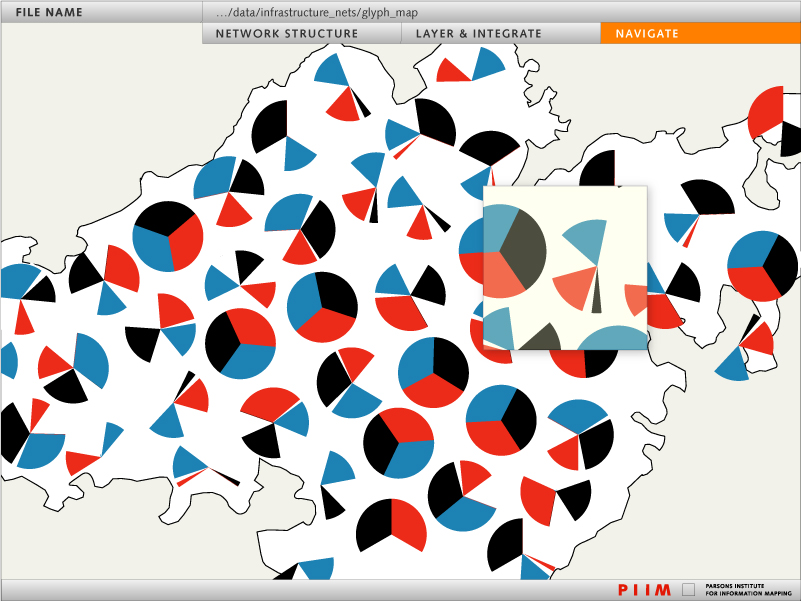 1235 1235 | 2006 computer graphics by Arno Klein and Nadia Ries-Shen (PIIM) Network visualizations can take unexpected forms, such as discontinuous yet related glyphs for wayfinding through regions with varying resources. Other network representations include node-link diagrams that can expose network vulnerabilities, highlight optimal paths, and cluster nodes for analysis, as well as radial formats that provide alternate ways of layering, integrating, and navigating networks. |
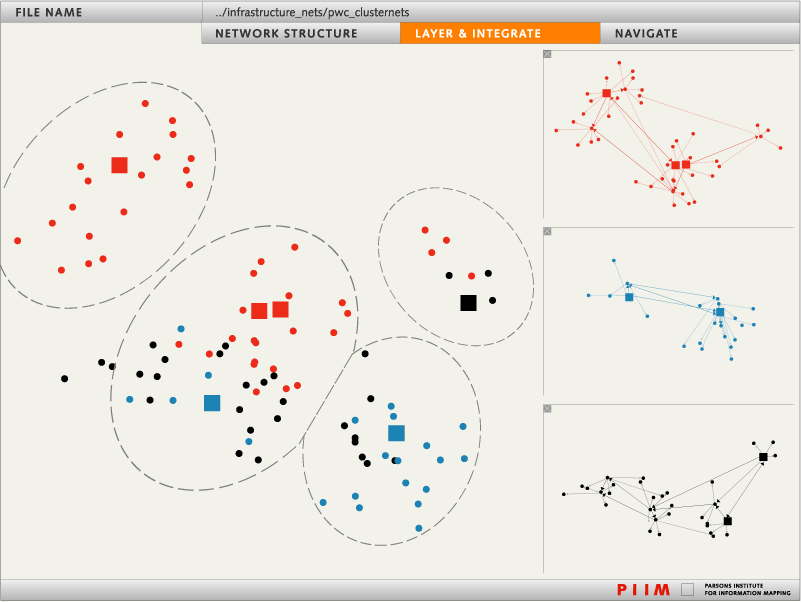
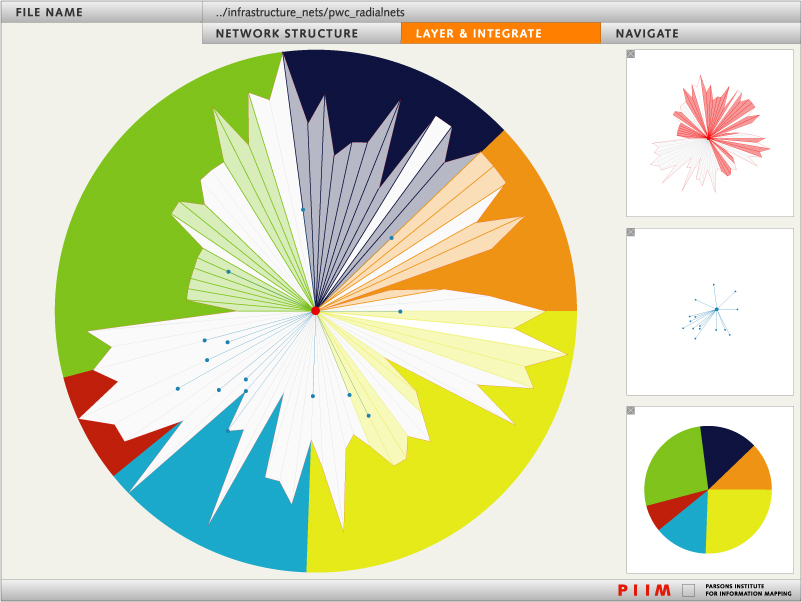 1233 1233 | 2006 computer graphics by Arno Klein and Sayoko Yoshida (PIIM) Layering and integrating networks presents information in a form for rapid analysis. Layers may consist of different network representations, such as node-link diagrams, radial formats, and quantitative icons. |
 1231 1231 | 2006 computer graphics by Jamie Smith, Arno Klein, and Nadia Ries-Shen (PIIM) Node-link diagrams can expose critical network vulnerabilities and highlight optimal paths. Networks can be represented in a multitude of forms quite distinct from node-link diagrams. For example, radial formats provide alternate ways of layering, integrating, and navigating networks, and even quantitative icons can help to explore the dynamics of interacting subnetworks. |
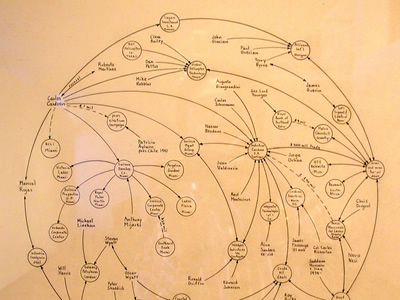
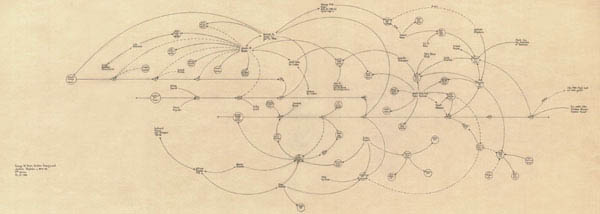 227 227 | 1999 drawing by Mark Lombardi (1955-2000) Mark Lombardi (1955-2000) was an abstract painter, best known for his network diagrams of crime and conspiracy. Lombardi's drawings attempt to document financial and political frauds by power brokers. Nodes in the diagrams represent individuals, corporations and government agencies, connected by lines showing associations, deals and so forth. His 1999 drawing, entitled George W. Bush, Harken Energy and Jackson Stephens, ca 1979-90, shows the proven connections between James Bath, the Bush and bin Laden families, and business deals in Texas and around the world. Thirteen lines originate with or point to James R. Bath, more than any other name presented. Among those linked to this obscure yet central character are George W. Bush, Jr., George H.W. Bush, Sr., Senator Lloyd Bentsen of Texas, Governor John B. Connally of Texas, Sheik Salim bin Laden of Saudi Arabia, and Sheik Salim's younger brother, Osama bin Laden. Lombardi's other network diagrams relate to the Iran-Contra Affair, World Finance Corporation, the Bay of Pigs invasion, and so forth. Each was based on thousands of notes gathered from news reports and written on index cards. |
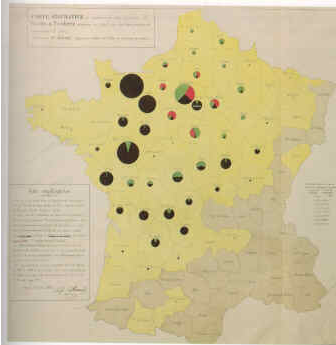 96 96 | 1851 print by Charles Joseph Minard (1781-1870), France Map incorporating statistical diagrams: circles proportional to coal production (published in 1861). Minard, C. J. (1861). Des Tableaux Graphiques et des Cartes Figuratives. Paris: E. Thunot et Cie. ENPC: 3386/C161; BNF: V-16168. |
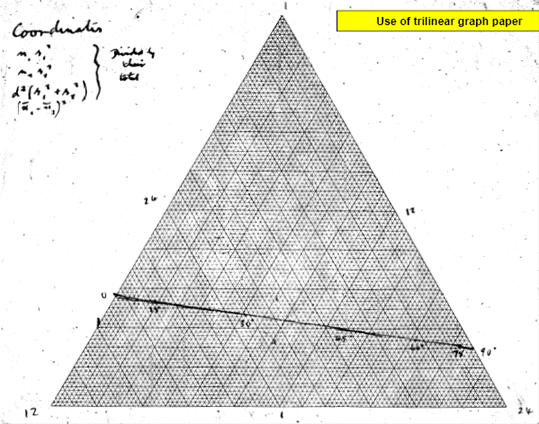 102 102 | 1873 print by R. A. Fisher, c.1955, after Josiah Willard Gibbs (1839-1903), USA Graphical methods applied to explain fundamental relations in thermodynamics; this includes diagrams of entropy vs. temperature (where work or heat is proportional to area), and the first use of trilinear coordinates (graphs of (x,y,z) where x+y+z=constant). Bumstead, H. A. (ed.) (1961). The Scientific Papers of J. Willard Gibbs . New York: Dover Publications, Inc. (an unabridged republication of the work originally published by Longmans, Green and Company in 1906). Gibbs, J. W. (1873). Graphical methods in the thermodynamics of fluids. Transactions of the Connecticut Academy of Arts and Sciences, 2:309-342. Reprinted in Bumstead (above). Gibbs, J. W. (1873). A method of geometrical representation of the thermodynamic properties of substances by means of surfaces. Transactions of the Connecticut Academy of Arts and Sciences, 2:382-404. Reprinted in Bumstead (above). |
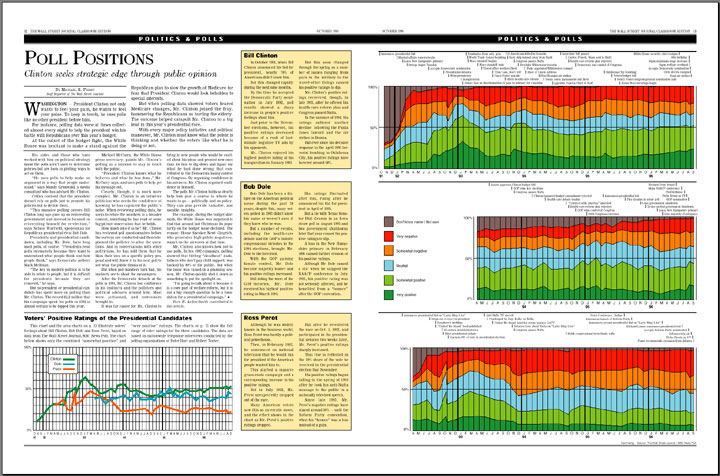 603 603 | computer graphics by Karl Hartig These charts illustrate voters' feelings about Bill Clinton, Bob Dole and Ross Perot, based on data from The Wall Street Journal/NBC News Poll. The chart on the left shows the combined "somewhat positive" and "very positive" voter ratings as a "horse race". The charts on the right show the full range of voter ratings for the three candidates. |
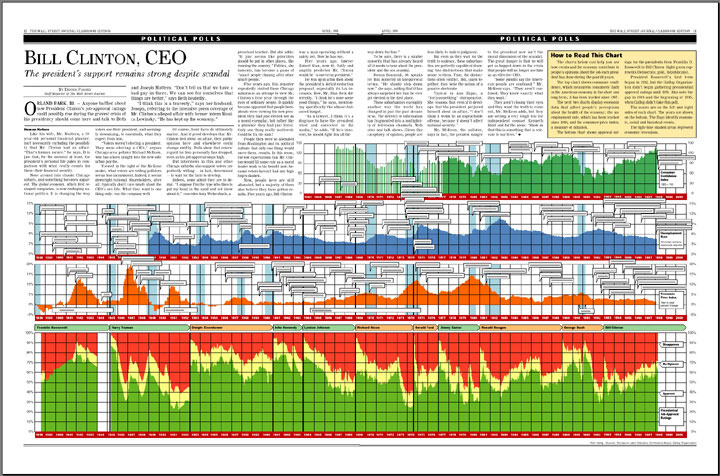 604 604 | computer graphics by Karl Hartig Charts of Presidential Job-Approval Ratings, Franklin Roosevelt to Bill Clinton, compared to charts of the Consumer Price Index, the Unemployment Rate and the Consumer Confidence Index. The charts show how events and the economy contribute to people's opinions about the job each president has done during the past 60 years. |
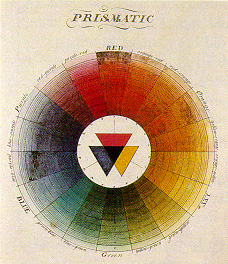 34 34 | 1766 print by Moses Harris (1731-1785), Germany Diagrams developed to represent color systems. In 1758, Mayer developed a system of constructing and naming many of the possible colours. Lambert extended this with a 3D pyramid indicating "depth" (saturation). Harris, M. (1766). The natural system of colours , chap. Prismatic color mixture system. Licester-Fields: Laidler. |
 117 117 | 1927 print by J. N. Washburne, USA Spate of articles on experimental tests of statistical graphical forms: R. von Huhn, F. E. Croxton, J. N. Washburne, USA. Washburne, J. N. (1927). An experimental study of various graphic, tabular and textual methods of presenting quantitative material. Journal of Educational Psychology, 18:361-376, 465-476. von Huhn, R. (1927). A discussion of the Eells' experiment. Journal of the American Statistical Association, 22:31-36. Croxton, F. E. (1927). Further studies in the graphic use of circles and bars. Journal of the American Statistical Association, 22:36-39. Croxton, F. E. and Stein, H. (1932). Graphic comparisons by bars, squares, circles and cubes. Journal of the American Statistical Association, 27:54-60. Croxton, F. E. and Stryker, R. E. (1927). Bar charts versus circle diagrams. Journal of the American Statistical Association, 22:473-482. |
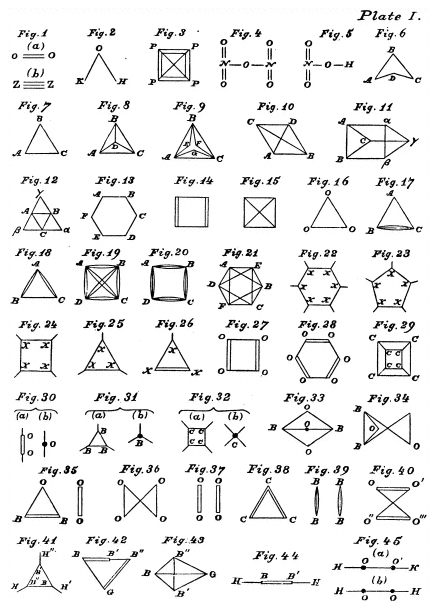 86 86 | 1878 print by James Joseph Sylvester (1814-1897), England The term "graph" introduced, referring to diagrams showing analogies between the chemical bonds in molecules and graphical representations of mathematical invariants (also coined the term "matrix"). Sylvester, J. J. (1878). On an application of the new atomic theory to the graphical representation of the invariants and covariants of binary quantics, with three appendices. American Journal of Mathematics, 1:64-128. |
 180 180 | 2005 computer graphics by Electronic Journal of Combinatorics Venn diagrams are often used in logic to show intersection relations among sets, but they are usually limited to being shown as three overlapping circles. Here (http://www.combinatorics.org/Surveys/ds5/VennSymmEJC.html) is a page that explains a general way to construct symmetric Venn diagrams using ellipses. The example shows a Venn diagram made from 5 congruent ellipses. The regions are colored according to the number of ellipses in which they are contained: grey = 0, yellow = 1, red = 2, blue = 3, green = 4, and black = 5. Note that the number of regions colored with a given color corresponds to the appropriate binomial coefficient: #(grey) = #(black) = 1, #(yellow) = #(green) = 5, and #(red) = #(blue) = 10. The Electronic Journal of Combinatorics (http://www.combinatorics.org/) has many other lovely examples and visual explanations. The Electronic Journal of Combinatorics (ed. June 2005), DS #5. |
 282 282 | 2001 computer graphics by TeleGeography, Inc. Example of the statistical maps and diagrams produced by TeleGeography, Inc. This map shows aggregate international Internet bandwidth between regions from 2001. [For more information see the Map of the Month article "TeleGeography's Traffic Flow Maps".] |
 284 284 | 2001 computer graphics by TeleGeography, Inc. Example of the statistical maps and diagrams produced by TeleGeography, Inc. This map shows telegeography routes between regions from 2001. [For more information see the Map of the Month article "TeleGeography's Traffic Flow Maps".] |
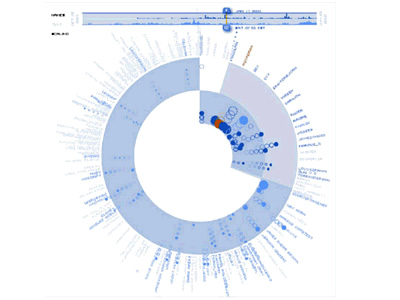 1070 1070 | computer graphics by Li-Te Cheng, Bernard Kerr Open source software, such as Firefox, Linux, and Eclipse, is created collaboratively by a group of individuals who make the code accessible to the public to both use and enhance. Seeing the pattern of contributions to these projects can provide useful insights into the vitality of the project and the community building it. The Bloom Diagram provides a visualization of contribution activity in open source projects. At a glance, this tool can summarize the overall level of coding and discussion in a project, show which individuals are the recent key contributors, and allow comparisons across multiple projects. The Bloom Diagram is being used to study Sourceforge.net, one of the most popular open source community sites, and the IIOSB (the IBM Internal Open Source Bazaar), a site hosted internally within IBM to promote open source-style development. The screenshot below is an example of the Bloom Diagram for a Sourceforge project. The upper left portion provides summary statistics about the project, for example the total number of events by commentor and coder. Using the slider in the timeline, top right, users can see the state of the project at different points in time. Users can also play an animation of the activity over time from this timeline. The inset on the bottom left is a live "magnifying glass" view around the current mouse position. Keyboard controls are also available to let users zoom in, out, and pan around the screen. This diagram gives us a clear sense of the overall proportion of coding to commenting activity in this project. The inner ring, which represents code events, takes up slightly more than a quarter of the circle. One quarter of the outer ring, which represents comment events, overlaps with the inner ring, revealing that only 25% of the community is commenting and coding. The majority of contributors (75%) are just discussing the project. When the user moves the timeline slider, animated bubbles appear in the inner or outer ring. A bubble in the inner ring represents a code event, while a bubble in the outer ring indicates a comment event. The bubble position as it animates provides a cue about the frequency and recency of the event. If the person associated with the event seldom contributes code or comments after that event, the bubble drifts outward, leaving a "trail" (a series of unfilled circles). If the person continues to create code or comments, the bubble moves back to its starting position, creating a "bounce-back" effect. Judging from this diagram, there seems to be a core group of developers who frequently contribute code (25% of the bubbles in the inner ring are bouncing around the center) and a peripheral group of people commenting on the project less frequently (75% bubbles in the outer ring with fewer bouncing toward the center). Bloom Diagrams can provide useful insights into how things are going on a project. For example, project leads can use them as a dashboard to monitor how often people are contributing and follow up when contributions start to slow. Potential contributors may decide whether or not to join a project depending on the activity they see. Hosting providers of open source projects can identify the hot projects to promote on the front pages of their community sites or check on the ones that seem to be dying down. |
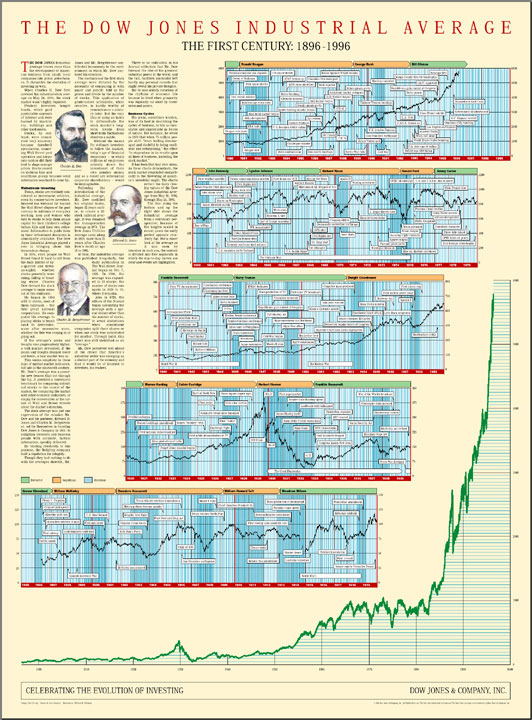 595 595 | computer graphics by Karl Hartig The First Century: 1896-1996 - 100 years of the daily Dow Jones Industrial Average as one 100 year chart and as five 20 year charts with historical flags. |
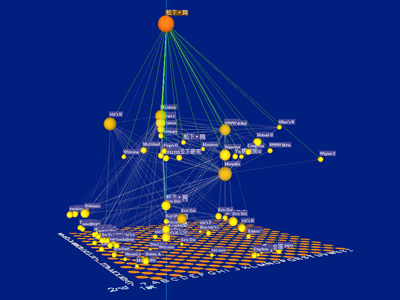 852 852 | computer graphics by H. Shiozawa, Y. Matsushita The Natto View proposes an effective use of the third dimension, taking full advantage of the Z axis: drawing diagrams in two dimensions and reminding the third dimension for interactive manipulation. The project is a set of 3D interactive visualizing techniques and provides dynamic focus+context operation for graph structure such as the World Wide Web. Information nodes, or HTML documents, are placed on the fundamental floor-plane in 3D space, and users can select and move arbitrary node with direct manipulation. As the user lifts a focused node up, the nodes to which it links are lifted up together, and thus complicated networks are disentangled dynamically. By three dimensional perspective technique, the user can view both details of information connections near the selected node and global context of the large information space like fisheye lens model. The differences of the Natto View from most of other graphical visualization are: It supports not only visualization but also interactive and dynamic manipulation on users' demand. It is a layout-independent method and thus suitable for dynamic enlargement of diagram such as incremental access to huge distributed information networks. |
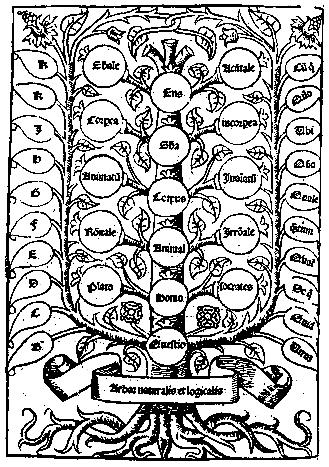 22 22 | 1305 print by Ramon Llull (1235-1316), Spain Mechanical diagrams of knowledge, as aids to reasoning (served as an inspiration to Leibnitz in the development of symbolic logic). |
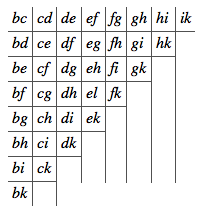 23 23 | 1280 by Ramon Llull (1235-1316), Spain Triangular diagrams of paired comparisons for electoral systems (how to elect a Pope or Mother Superior, when all the candidates are voting). |
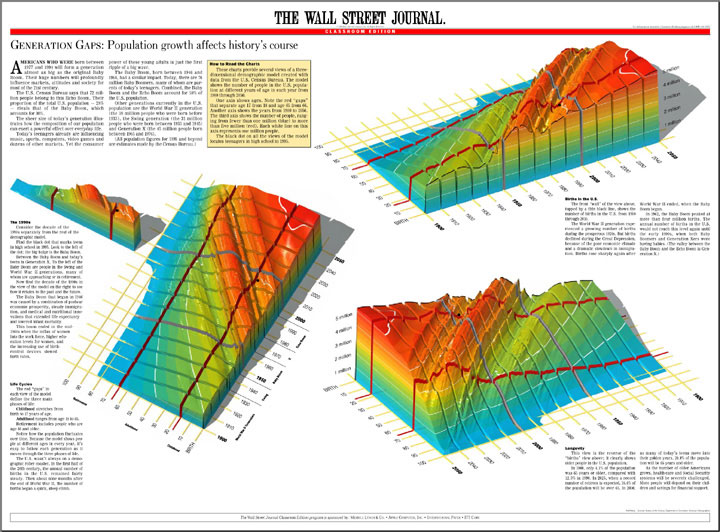 597 597 | computer graphics by Karl Hartig Three views of a three-dimensional model created with U.S. Census data. The model is a visualization of the distribution of people in the U.S. population from birth to age 100, for each year from 1900 through 2050. The wave down the middle is the Baby Boom moving though time. The valley in front of it is the effect of The Great Depression on the birth rate. |
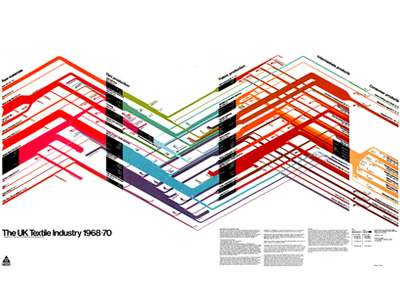 778 778 | computer graphics by (unknown) This chart represents a flow of products through the UK textile industry from the intake of raw materials to the point at which products leave the textile and clothing industries. Commissioned by NEDO - The National Development Office. Source: Herdeg, Walter. Graphis Diagrams. 4th Expanded ed. Zurich, Switzerland: Graphics Press Corp., 1981. |
 88 88 | 1880 print by John Venn (1834-1923), England Representation of logical propositions and relations diagrammatically. [Actually, Liebnitz and, to some degree, Euler had used such diagrams previously.]. Venn, J. (1880). On the diagrammatic and mechanical representation of propositions and reasonings. The London, Edinburgh, and Dublin Philosophical Magazine and Journal of Science, 9:1-18. Venn, J. (1881). Symbolic Logic. London: MacMillan. |
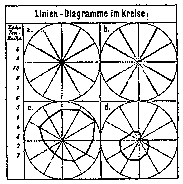 97 97 | 1877 print by Georg von Mayr (1841-1925), Germany First use of polar diagrams and star plots for data representation. Mayr, G. v. (1877). Die Gesetzmäßigkeit im Gesellschaftsleben. Oldenbourg. Ostermann, R. (1999). Georg von Mayrs beiträge zur statistichen graphik. Algemeines Statistiches Archiv, 83(3):350-362. |
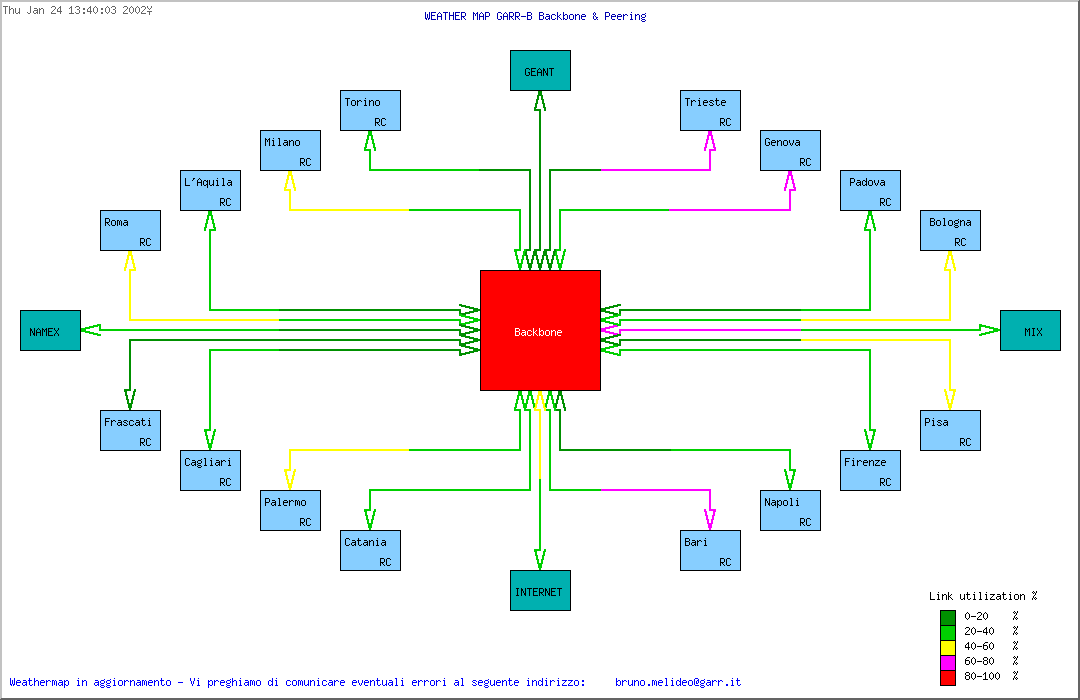 503 503 | computer graphics Weather maps can also use non-geographic, topological diagrams to represent the network structure. This example diagram shows the traffic load on the GARR-B network in Italy. |
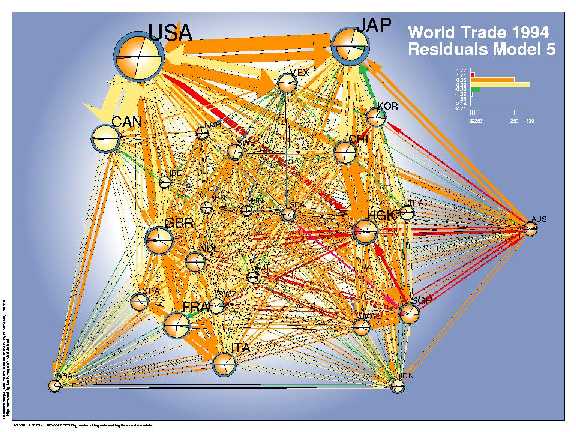 176 176 | 1998 by Lothar Krempel and Thomas Plumper Network diagrams are often used to show the relations between pairs of objects. Among other difficulties, it is hard to produce a pleasing arrangement of the nodes and links, and hard to use a network diagram as a data display. Krempel and Plümper used the geographic distances among 26 countries with a spring-embedding algorithm to obtain a simplistic geographical layout. They fit a series of regression models predicting the amount of bilateral trade between these countries, and used the network diagram to show both the data (trade volume) and the residuals (errors) from a given model. This visual procedure was used to suggest additional variables to be included into the models. The network diagrams show the volumes of bilateral trade (sizes of the arrows) and use colors to depict the errors of a given model--- which countries trade more than estimated (orange, red) or less (green, blue). The size of the country symbols stands for their volume of trade (in $ US), the balance of trade can be read from the comparision of the imports (bottom) and the exports (top). The pie slices indicate the degree to which the volume of the imports and exports (size) of a single country are overestimated respectively underestimated (colors). Model 2, which accounts for geographical distance and the GDP of the importing and exporting countries, shows a systematic regional imperfection of the estimates for the Pacific region. An enhanced model accounts additionally for joint borders, joint oceans regional economic areas and yields an improved fit. Nevertheless one can easily detect a systematic component in the errors, which points to the importance of the former British Commonwealth (GBR - HKG - AUS) for which the trade volumes are systematically underestimated. From Lothar Krempel and Thomas Plümper, Exploring the Dynamics of International Trade by Combining the Comparative Advantages of Multivariate Statistics and Network Visualisations An online version and the color images are available under: Version 2.1. 14.07.1998 http://www.mpi-fg-koeln.mpg.de/~lk/netvis/visualtrade |
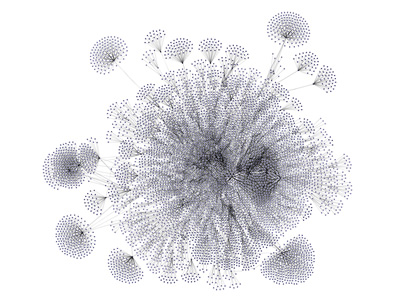 932 932 | 2005 computer graphics by (unknown) yFiles is an extensive Java class library that provides algorithms and components enabling the analysis, visualization, and the automatic layout of graphs, diagrams, and networks. The yFiles library offers the user many advantages, one of which is its ability to create, edit, and visualize large graphs with hundreds and thousands of elements. Here shown is a huge site map laid out and routed organically. For a large version of this image click here. |