Found 4 results for "exhibiting":
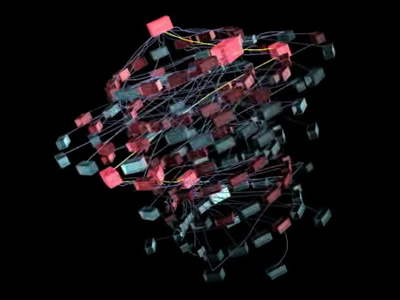 909 909 | 2005 computer graphics by Ero Carrera, Gergely Erdelyi Windows binary malware has come a long way. Today's average worm is often tens or hundreds of kilobytes of code exhibiting a level of complexity that surpasses even some operating systems. This degree of complexity, coupled with the overwhelming flow of new malware, calls for improvements to tools and techniques used in analysis. F-Secure produced this rich 3D animation that visualizes the structure and execution of the W32/Bagle.AG@mm worm. The boxes in the picture are functions of the worm. The one on the top is the 'main' where the execution starts. The first ring contains all the functions that 'main' calls. The second all the functions that the ones on the first ones call and so on. All connecting lines represent the calls from one function to the other. Red boxes belong to the virus code while the blue ones are API calls library code that do not belong to the malicious code. The animation was created using IDA Pro, IDAPython, Blender and other custom scripts. For a direct link to the animation (quicktime required), click here. |
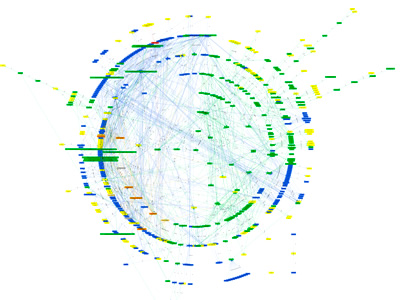
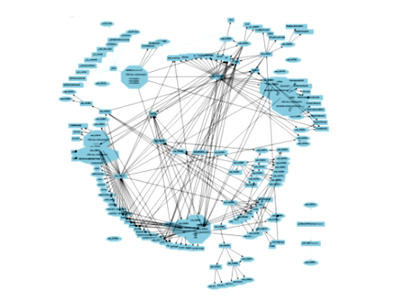 870 870 | 2004 computer graphics by Ero Carrera, Gergely Erdelyi Windows binary malware has come a long way. Today's average worm is often tens or hundreds of kilobytes of code exhibiting a level of complexity that surpasses even some operating systems. This degree of complexity, coupled with the overwhelming flow of new malware, calls for improvements to tools and techniques used in analysis. The authors focused greatly on graph theory to aid the analysis of these viruses. They use a series of tools for reverse engineering malware such as: IDA - the Interactive DisAssembler, IDAPython - Python extension for IDA, and pydot - Python interface to Graphviz utilities. IDAPython and pydot were developed by the authors and released as open source. The resulting graphs are done by exploring the code of a malware sample looking for all the functions and the relationships between them (who calls who). This information, together with text references, are then exported using pydot into a format that Graphviz utilities can read. These two images illustrate a comparative analysis between two viruses, respectively, Netsky.AD (first image) and Buchon (second image). |
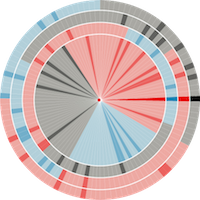
 869 869 | 2004 computer graphics by Ero Carrera, Gergely Erdelyi Windows binary malware has come a long way. Today's average worm is often tens or hundreds of kilobytes of code exhibiting a level of complexity that surpasses even some operating systems. This degree of complexity, coupled with the overwhelming flow of new malware, calls for improvements to tools and techniques used in analysis. The authors focused greatly on graph theory to aid the analysis of these viruses. They use a series of tools for reverse engineering malware such as: IDA - the Interactive DisAssembler, IDAPython - Python extension for IDA, and pydot - Python interface to Graphviz utilities. IDAPython and pydot were developed by the authors and released as open source. The resulting graphs are done by exploring the code of a malware sample looking for all the functions and the relationships between them (who calls who). This information, together with text references, are then exported using pydot into a format that Graphviz utilities can read. These images show a graph representing the structure of the Sobig.F Virus. |
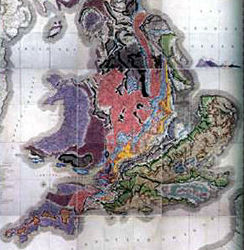 62 62 | 1801 print by William Smith (1769-1839), England The first large-scale geological map of England and Wales, setting the pattern for geological cartography, and founding stratigraphic geology. Recently called (hyperbolically) "the map that changed the world." (Smith's map was first drawn in 1801, but the final version was not published until 1815.) Smith, W. (Feb. 1815). A delineation of the strata of England and Wales, with part of Scotland; exhibiting the collieries and mines, the marshes and fenlands originally overflowed by the sea, and the varieties of soil according to the substrata, illustrated by the most descriptive names . London: John Cary. BL: Maps 1180.(19). Morton, J. L. (1992). Strata: How William Smith drew the First map of the Earth in 1801 and inspired the Science of Geology. Stroud, England: Tempus Publishing. ISBN 0 7524 1992. Winchester, S. (2001). The Map That Changed the World: William Smith and the Birth of Modern Geology. New York: Harper Collins. |