
Found 11 results for "subway":
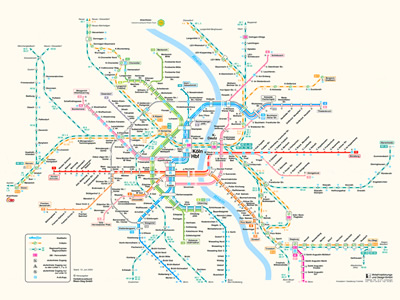 987 987 | 2004 computer graphics by i + d Verkehrsplanungs- und Desi U-Bahn is the German abbreviation for Untergrund-Bahn (literally, underground railway), referring to a means of urban rapid transit, internationally known as subway, underground or metro. The term was created at the beginning of the 20th century in Berlin, where the Deutsche Reichsbahn Gesellschaft (German Imperial Railways Company) - predecessor of today's Deutsche Bahn AG (German Railways Inc.) created a system of urban and suburban railway lines with fast electric trains and short service intervals, called the S-Bahn (abrev. for Schnellbahn - Fast Railways). This map represents both U-Bahn and S-Bahn routes in the city of Cologne (Koln) in Germany. Cologne started to build tunnels for their existing tramway cars, rebuilding existing tramway lines under ground. Those systems of classical tramways routed through tunnels in downtown areas do not meet the criteria for a metro; they are light rail systems. Nonetheless, they are usually referred to as U-Bahn. Officially, they are called Stadtbahn (City Railways) or U-Stadtbahn. |
 305 305 | computer graphics by Don Bruns (coding) Maps can be useful tools for cataloguing weblogs based on the location of the blogger. Here are three informative blog maps that make use of iconic subway maps for their respective cities to provide a strong visual template. This map shows the D.C. Metro blog map for Washington D.C. |
 368 368 | computer graphics A map of the Interoute i-21 network spanning much of Europe. It is a nice example of the use of a subway map metaphor. |
 313 313 | computer graphics Maps can be useful tools for cataloguing weblogs based on the location of the blogger. Here are three informative blog maps that make use of iconic subway maps for their respective cities to provide a strong visual template. This is a screenshot of the London bloggers tube map. |
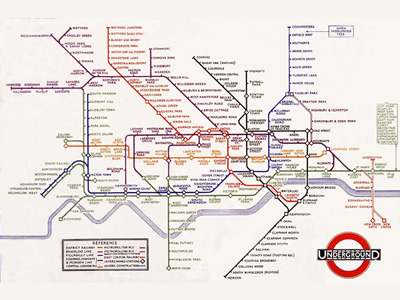 902 902 | 1933 computer graphics by Harry Beck The father of all subway maps, the London Underground map, was the brainchild of Underground electrical draughtsman, Harry Beck, who produced this imaginative yet stunningly simple design back in 1933. Beck based the map on the circuit diagrams he drew for his day job, stripping the sprawling Tube network down to basics and ignoring the exact geographical location of the tube stations. The result was an instantly clear and comprehensible chart that would become an essential guide to London - and a template for transport maps the world over. Beck's revolutionary design, with certain modifications and additions, survives to the present day and is set to serve London Underground and its millions of customers for many years to come. The first image represents Beck's original map from 1933, while the second image shows the most up-to-date version of the London Underground map. To view the map according to its accurate geographical location click here. |
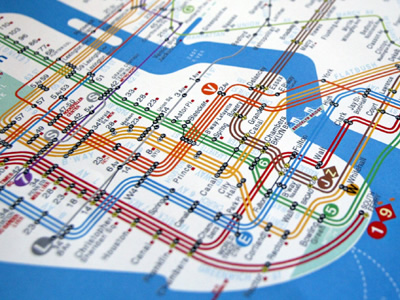
 978 978 | 1972 computer graphics by Massimo Vignelli In 1972, the renowned Italian designer Massimo Vignelli redesigned George Salomon's New York Subway map, which persisted until 1979, when superseded by Michael Hertz's design. It was a marvelous conceptual map, and it was easy to read. It was a tool for navigating the subways, although not one for navigating the city streets. Out with the complicated tangle of geographically accurate train routes. No more messy angles. Instead, train lines would run at 45 and 90 angles only. Each line was represented by a color. Each stop represented by a dot. There was an obvious influence from the London Underground map, originally created by Harry Beck in 1933, however, Vignelli took it one step farther, in creating the now-famous intertwined wiring-diagram map of New York's vastly complicated subway lines. The result was a design solution of surprising beauty. However, Massimo Vignelli reached a level of abstraction that quickly ran into problems. To make the map work graphically meant that a few geographic liberties had to be taken. For instance, Vignelli's map represented Central Park as a square, when in fact it is three times as long as it is wide. It is said that Vignelli had planned a second, complementary map that would have been more tied to the actual above-ground geography, but the city never let him do it. |
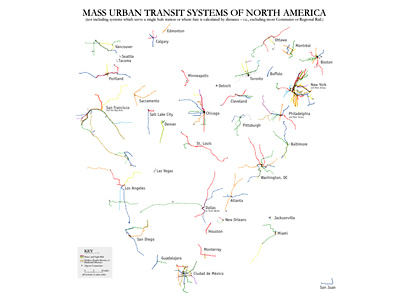 947 947 | 2005 computer graphics by Bill Rankin This map, produced by Bill Rankin, illustrates all mass urban transit systems of North America in a single space, facilitating a quick overview and density comparison between subway systems of different cities. At a glance, many metros seem to be comparable in scale, but what separates New York from Baltimore is density: station-to-station distance, line overlap, and linkages. Most systems are organized as a hub with spokes; the two notable exceptions are New York and Mexico City, both of which are more like nets. The map doesn't include systems which serve a single hub station or where fare is calculated by distance. |
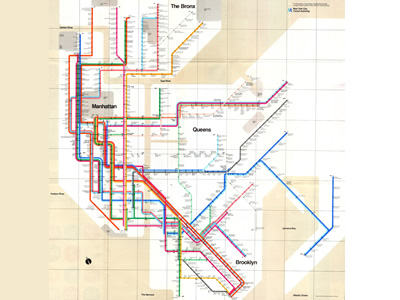
 979 979 | 2004 computer graphics by Eddie Jabbour Eddie Jabbour, Creative Director at Kick Design, New York, is a tireless advocate for a new map design and communication solution for the world's most complex subway system. The NYC subway is indeed a challenge by itself. It has the biggest number of stations in the world (468), the second longest network and it's seventh in daily passenger numbers. But that didn't seem to intimidate Eddie Jabbour, who has produced a truly impressive proposal for redesigning the New York City subway map. He has made it easier to see all the different lines and made it clearer to identify the stations. The new map has not yet been released in totality, but Kick Design has put some samples out, which look exciting. |
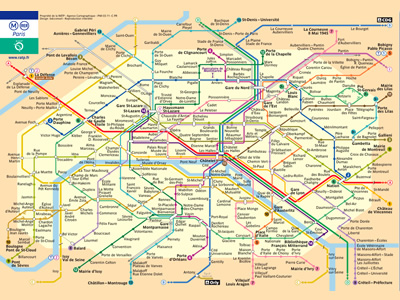 965 965 | 2003 computer graphics by bdcconseil The Paris Metro was originally known as the "Chemin de Fer Metropolitain" ("Metropolitan railway"), then "Metropolitain," quickly abbreviated to "Metro". Inaugurated in 1900, it is one of the oldest subway systems in the world, and the second biggest in number of stations, right next to New York City. The system consists of 16 lines, identified by numbers from 1 to 14, with two minor lines 3bis and 7bis, numbered thus because they are branch lines split off from their respective original lines. The Paris Metro network has 221.6 km (137.7 miles) of track and 380 stations (87 offering connection between lines). Most of the network was built from 1900 to 1939. After the war, most extension focused on the RER, a metropolitan express subway system. The images shown here are representative of the latest re-design of the Metro map, produced by the design agency bdcconseil (http://www.bdcconseil.com) in 2003. Click here to see the Paris metro network pictured at a geographically accurate scale. |
 318 318 | computer graphics by Mike Everett-Lane, Liz ?, and Matt Johnson Maps can be useful tools for cataloguing weblogs based on the location of the blogger. Here are three informative blog maps that make use of iconic subway maps for their respective cities to provide a strong visual template. This is a screenshot of the nyc bloggers subway map. http://www.nycbloggers.com/ From the website (June 2007): The idea is simple: A map of the city that shows where the bloggers are, organized by subway stop. Find out who's blogging in your neighborhood! You can click on the map to start exploring. The overview map will show you how many blogs are in each borough, and the borough maps will show you how many blogs are at each station. Click on the station to get the list of blogs. You can also browse by subway line, using the buttons on the right. And you can search for a specific blog by name using the search feature. |
 1042 1042 | computer graphics by (unknown) |