Found 41 results for "New York":
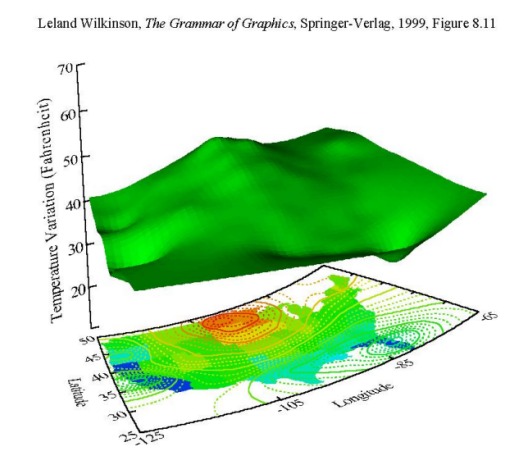 134 134 | 1999 computer graphics by Leland Wilkinson (1944-), USA Grammar of Graphics: A comprehensive systematization of grammatical rules for data and graphs and graph algebras within an object-oriented, computational framework. Wilkinson, L. (1999). The Grammar of Graphics. New York: Springer. ISBN 0-387-98774-6. |
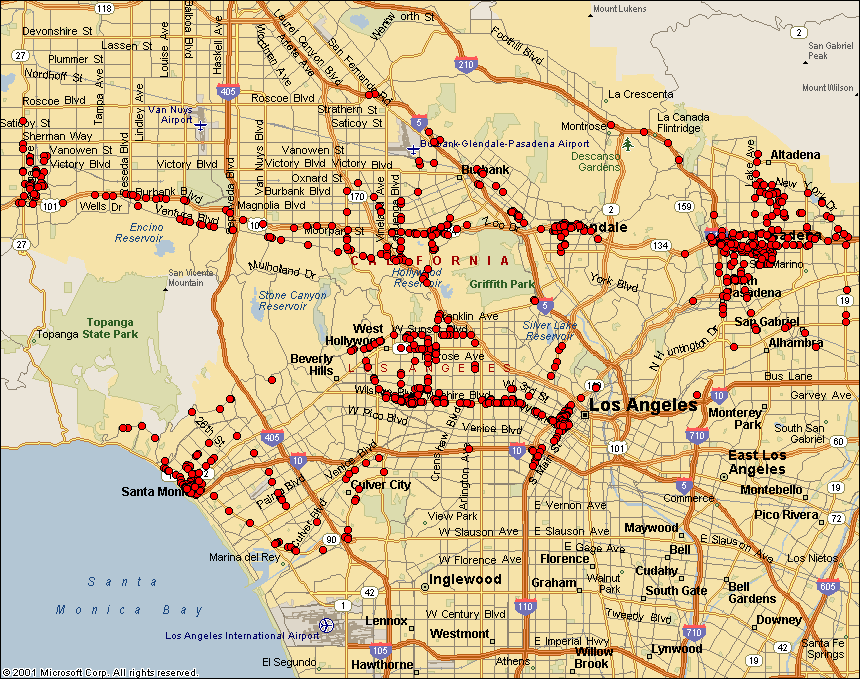 538 538 | computer graphics by Frank Keeney 802.11b Wireless Networks One of the most interesting area of wireless network provision in the last couple years has been the emergence of community LANs based on sharing network access using the the 802.11b standard (commonly known as Wi-Fi or WLAN). Many local groups are forming in cities. This is largely an unplanned, activist lead movement, working to share access for free. Here are example maps produced by different groups in London, New York City, and Seattle. These maps show the location of WLAN base station nodes that provide wireless access. People are searching for active 802.11b nodes by so called 'war driving' - i.e. driving around sniffing for unsecured wireless networks. (This is named after the 80s idea of war dialing.) This example map by Frank Keeney shows the results of his war driving in the Los Angeles area. A useful review article, "802.11b Access Point Mapping", by Simon Byers and Dave Kormann, Communications of the ACM, May 2003. Many other WLAN groups are organising in cities and towns in many countries. A comprehensive list is provided by the Personal Telco Project. Also worth checking out is Freenetworks.org. Background information on the 802.11b free network movement: "A LAN line", The Economist,11th January 2001. "Motley Crew Beams No-Cost Broadband to New York High Speed Freed", Village Voice, by Peter Meyers, 15th August 2001. |
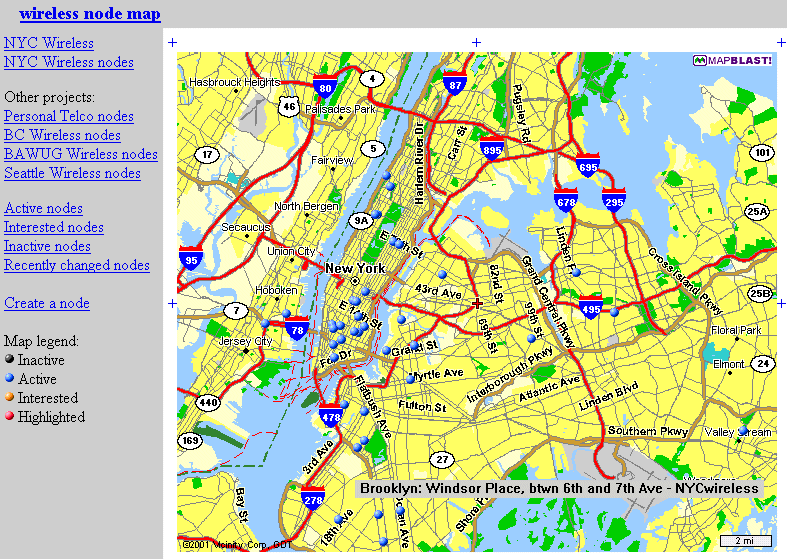 532 532 | computer graphics 802.11b Wireless Networks One of the most interesting area of wireless network provision in the last couple years has been the emergence of community LANs based on sharing network access using the the 802.11b standard (commonly known as Wi-Fi or WLAN). Many local groups are forming in cities. This is largely an unplanned, activist lead movement, working to share access for free. The blue dots on the map show bases stations registered with NYCWireless in New York City. This map shows the location of WLAN base station nodes that provide wireless access. A useful review article, "802.11b Access Point Mapping", by Simon Byers and Dave Kormann, Communications of the ACM, May 2003. Many other WLAN groups are organising in cities and towns in many countries. A comprehensive list is provided by the Personal Telco Project. Also worth checking out is Freenetworks.org. Background information on the 802.11b free network movement: "A LAN line", The Economist,11th January 2001. "Motley Crew Beams No-Cost Broadband to New York High Speed Freed", Village Voice, by Peter Meyers, 15th August 2001. |
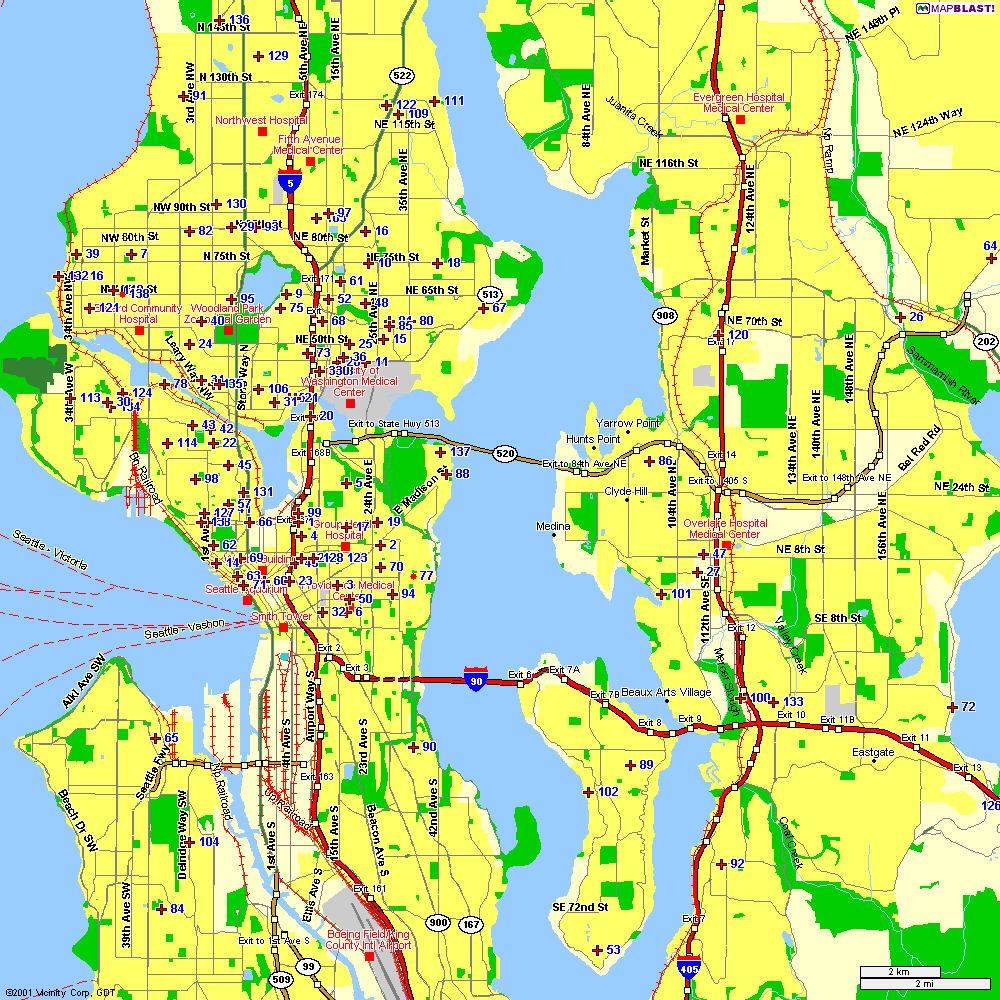 535 535 | computer graphics One of the most interesting areas of wireless network provision in the last couple years has been the emergence of community LANs based on sharing network access using the the 802.11b standard (commonly known as Wi-Fi or WLAN). Many local groups are forming in cities. This is largely an unplanned, activist lead movement, working to share access for free. This is a 802.11b network node map from Seattle Wireless. This map shows the location of WLAN base station nodes that provide wireless access. A useful review article, "802.11b Access Point Mapping", by Simon Byers and Dave Kormann, Communications of the ACM, May 2003. Many other WLAN groups are organising in cities and towns in many countries. A comprehensive list is provided by the Personal Telco Project. Also worth checking out is Freenetworks.org. Background information on the 802.11b free network movement: "A LAN line", The Economist,11th January 2001. "Motley Crew Beams No-Cost Broadband to New York High Speed Freed", Village Voice, by Peter Meyers, 15th August 2001. |
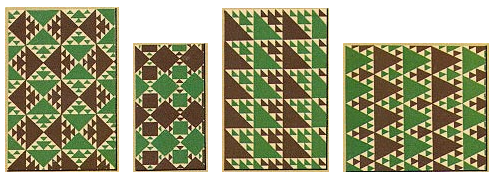
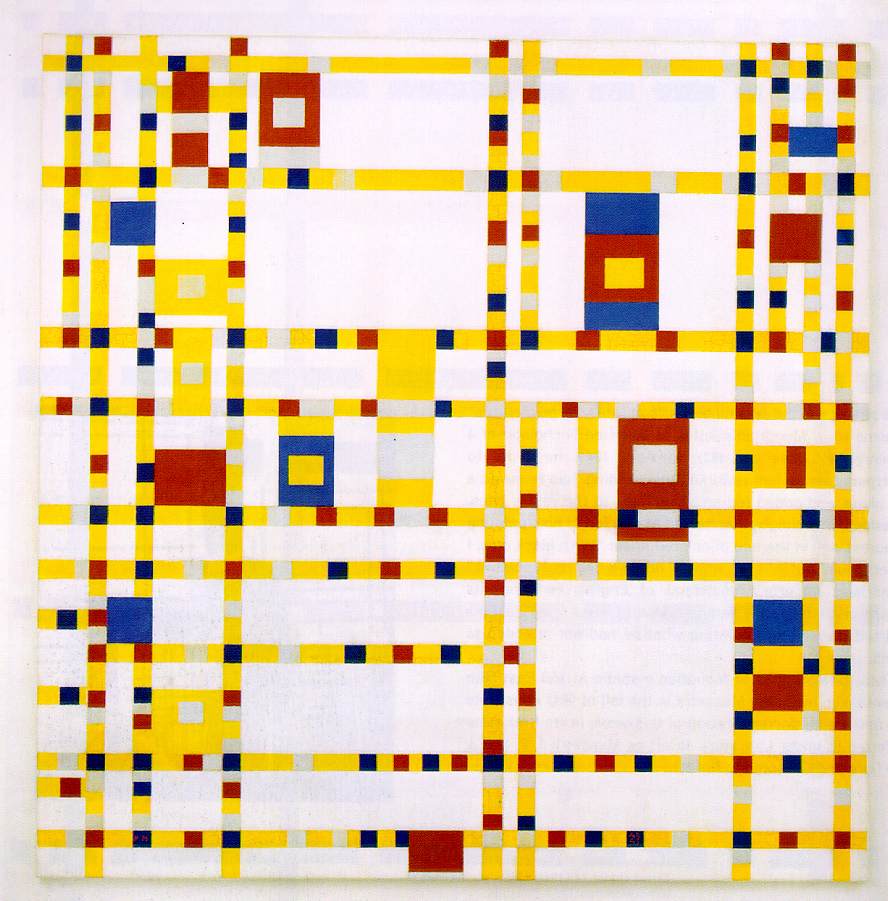 197 197 | 1942 oil on canvas by Piet Mondrian This is not an actual tessellation since it does not repeat. However, the heavy usage of squares and rectangles is a technique that can create tessellations easily. The coloring technique is also interesting. Mondrian balances the three colors used in this design (the primary colors plus gray) to give balance to the artwork. (Posted by Nicolas Pioch.) The Museum of Modern Art, New York |
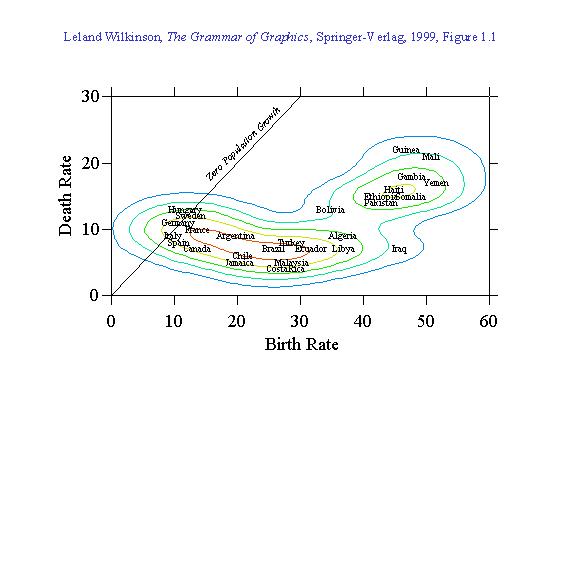 135 135 | 1999 computer graphics by Leland Wilkinson (1944-), USA Grammar of Graphics: A comprehensive systematization of grammatical rules for data and graphs and graph algebras within an object-oriented, computational framework. Wilkinson, L. (1999). The Grammar of Graphics. New York: Springer. ISBN 0-387-98774-6. |
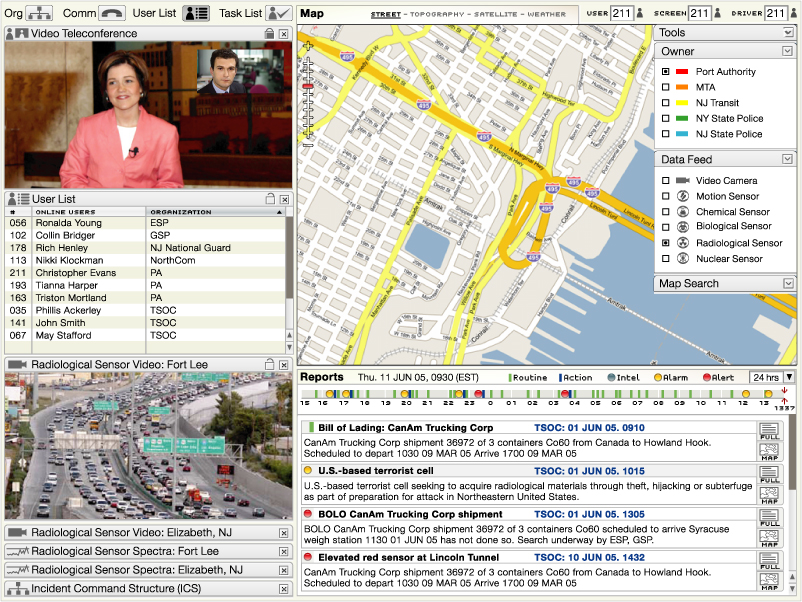 1212 1212 | 2006 computer graphics by Parsons Institute for Information Mapping (PIIM) This desktop-based visual platform is an integrated, intuitive environment for enabling situation awareness, in use by the Port Authority of New York and New Jersey. The EOC allows users to "drill down" for further information about narrative event data, and to share and exchange such information. PIIM provided the conceptualization, storyboarding, visualization and design of the graphical user interface. Key features include: The EOC tool brings together geospatial data, situation reports, data feeds and video teleconference capabilities through a single platform. Agencies can share data feeds among themselves, with users accessing feed location, output and metadata. User lists, organizational information, and shared task lists allow for collaboration across agencies and locations. Users can access map views and full-text reports from summaries. |
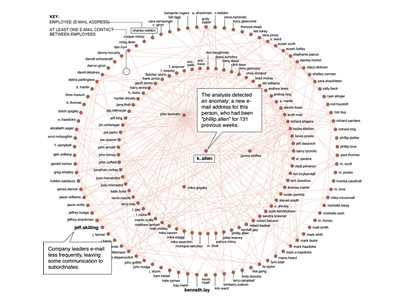 983 983 | 2005 computer graphics by Bill Marsh In 2003, the US Federal Energy Regulatory Commission posted about 1.5 million messages from Enron's e-mail servers on its Web site. After duplicates were weeded out, a half-million e-mails were left from about 150 accounts, including those of the company's top executives. Most were sent from 1999 to 2001, a period when Enron executives were manipulating financial data, making false public statements, engaging in insider trading, and the company was coming under scrutiny by regulators. This graph produced by The New York Times reveals a map of a week's e-mail patterns in May 2001, when a new name suddenly appeared. Scientists found that this week's pattern differed greatly from others, suggesting different conversations were taking place that might interest investigators. Source: The New York Times. Dr. Carey E. Priebe and Youngser Park, Johns Hopkins University. |
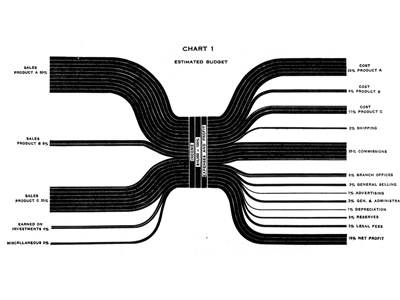 784 784 | 1940 computer graphics by (unknown) A graph of a Budget prepared on a Cosmograph. Source: H. Arkin., Graphs: How to make and use them (Harper & Brothers Publishers, New York, ed. Revised, 1940). |
 1027 1027 | 2004 computer graphics by Richard Jones Google Cartography uses the Google Search API to build a visual representation of the interconnectivity of streets in an area. It is indeed a very innovative and appealing concept, particularly since its interactive functionality allows a deeper understanding of the vast mesh of intersections that form a city's street network. This application takes a starting street and finds streets that intersect with it. Traversing the streets in a breadth-first manner, further intersections are discovered. Eventually a connected graph is produced showing the interconnectivity of streets flowing from the starting street. The largest connected subgraph is visualized using a Radial Layout algorithm provided by the Prefuse graph visualization framework. The graph is initially centered on the start street but will automatically adjust its focus to center around the most recently selected street. On the provided URL you can try navigating through the streets of New York or Melbourne, or in case you have a Google key, you can explore your own area. |
 1010 1010 | 2006 computer graphics by Ben Fry As part of its 2006 February 20 Issue, dedicated to "The Blog Establishment", New York Magazine commissioned Ben Fry to map the connections between the most-linked-to 50 blogs, using data from Technorati. Each arrow represents a hypertext link that was made sometime in the previous 90 days. The Blogosphere encompasses a vast communication network of interconnected individuals (bloggers) who are linked by shared interests and patterned flows of information. Links between blogs (blogrolling) represent recognition votes in an endless global popularity poll. Some top-50 sites don't have any links from the others shown here, mainly because they are from countries other then the USA, such as Japan, China, Spain or Germany; and therefore, they have a tendency to remain within their immediate linguistic/cultural community. On the top 3 popularity list is Boing Boing, Engadget and PostSecret. For an updated listing on Technorati click here. |
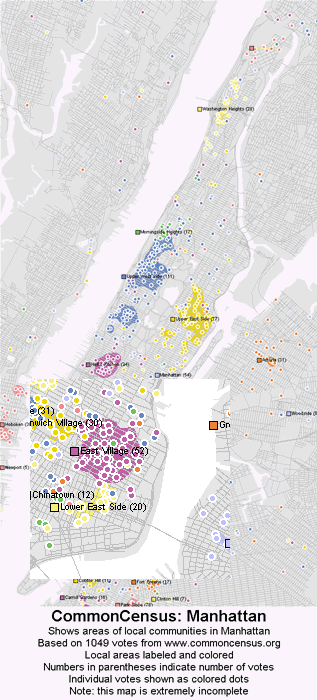 624 624 | 20070827 computer graphics by The Commoncensus Project Local maps draw the geographic responses to the question, "What do you consider to be your local community?" The results are interesting because in some areas people select neighborhoods, in others towns or cities, and in others towns or cities that differ from the boundaries set by governments or the post office. However, a very large amount of data is necessary to draw these maps, so expect only a few maps of the most populated cities over the next few months. More comprehensive coverage will come over the years. This demonstration map is extremely inaccurate and spotty, and intended only to give an idea of how the data is starting to take shape. Individual colored votes are shown by exact location, and areas that have received enough votes have been shaded the neighborhood's color. Most of the map has been left gray, for areas without enough votes. It is interesting to note that while a significant minority of people choose to identify their local community as 'Manhattan' or 'New York', the majority chooses to identify their neighborhood. First added Oct. 31, 2005. |
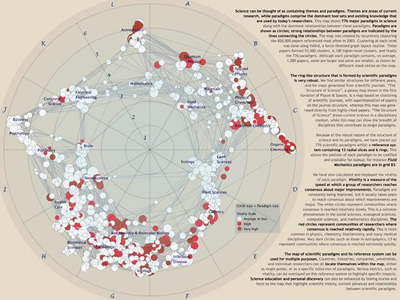 1028 1028 | 2006 computer graphics by Kevin W. Boyack, Richard Klavans Dr. Kevin Boyack is in the Computation, Computers, and Mathematics Center at Sandia National Laboratories. Richard Klavans is with SciTech Strategies, Inc. They are interested in the mapping of science as a platform for planning and evaluation on national, corporate, and personal levels. Science can be thought of as containing themes and paradigms; themes are current areas of research while paradigms comprise the dominant tool sets and existing knowledge that are used by current researchers. To generate this map, Boyack and Klavans recursively clustered (using the VxOrd graph layout tool) the 820,000 most important papers referenced in 2003, resulting in 776 paradigms. The most dominant relationships between paradigms were also calculated and are shown as lines between paradigms. The map of scientific paradigms comprises a reference system that can be used for multiple purposes. Countries, industries, companies, and individual researchers can all locate themselves within the map, either as single points, or as a specific collection of paradigms. Science education and discovery can also be enhanced by linking stories and facts to the map that highlight content and relationships between scientific paradigms. This map will be on display at the NYPL Science, Industry, and Business Library, New York, as part of the "Places & Spaces: Mapping Science" exhibition, from April 3rd - August 31st, 2006. |
 142 142 | 1981 computer graphics by John Hartigan and Beat Kleiner, USA Mosaic display á la Hartigan and Kleiner. Hartigan, J. A. and Kleiner, B. (1981). Mosaics for contingency tables. In W. F. Eddy (ed.), Computer Science and Statistics: Proceedings of the 13th Symposium on the Interface, pp. 268-273. New York, NY: Springer-Verlag. Friendly, M. (2002). A brief history of the mosaic display. Journal of Computational and Graphical Statistics, 11(1):89-107. |
 202 202 | From the book: Racinet, Auguste. Full-Color Picture Sourcebook of Historic Ornament: All 120 Plates from "L'Ornement Polychrome," Series II. New York: Dover Publications, Inc., 1989. Location: Plate 54 Meyer, Franz Sales. Handbook of Ornament. New York: Dover Publications, Inc., 1957. |
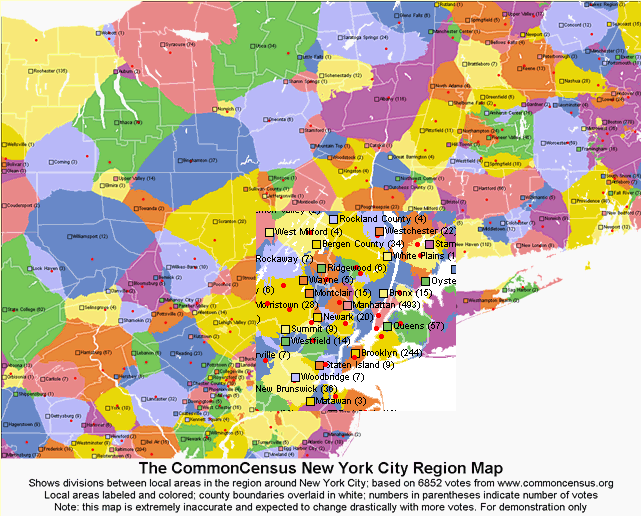 625 625 | computer graphics by The Commoncensus Project Regional maps draw what respondents consider to be their "local areas", in response to the question, "Please choose the name of the local community that you feel is the natural cultural and economic center within your local area." Or, if you feel a general name (i.e. "Hope Valley", "Pleasant Lake Area" or "Midway-Fairview Area") is more descriptive of your local area culturally than the name of a single central community, then please give what you feel to be the best commonly accepted name for your local area." To produce regional maps, many more votes are needed than for the national map, because of the greater level of detail. More maps for different regions of the country will be posted over the next few months as more votes allow initial versions to be drawn. This demonstration map is extremely inaccurate and intended only to give an idea of how the data is starting to take shape. Some areas are based on just a few votes and a lot of extrapolation. The area includes parts of New York State, Pennsylvania, New Jersey, Connecticut, Massachusetts and others. County boundaries are overlaid in faint white, to allow for comparison. First added Nov. 2, 2005. |
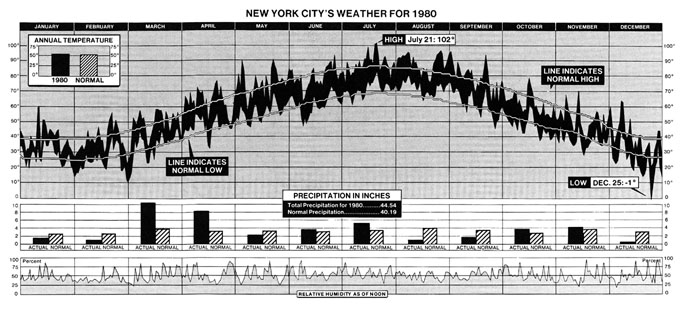 173 173 | 1981 print by New York Times Newspapers and magazines usually choose simplicity over detail, because it is hard to show much information in a single, comprehensible display. A collection of truly bad examples from the popular media are shown on our Darts pages. Here, the attention to detail, and to graphic design are evident. This graph, from the New York Times (Jan. 11, 1981, p. 32; Tufte (1983), p. 30) shows--- both valiantly, and sucessfully--- 2200 numbers which summarize the trends and patterns in weather in New York City in 1980. The three aligned charts show temperature, precipitation, and relative humidity. In the graph of temperature, the area is filled between the daily low and daily high. What makes this graph successful, in spite of the large amount of information presented are (a) clear visual comparisons between the 1980 data and the long-run average, (b) clear textual labels, (c) visual segregation between the three series. For example, it is easy to see that March and April were about of normal temperature, but a lot wetter. |
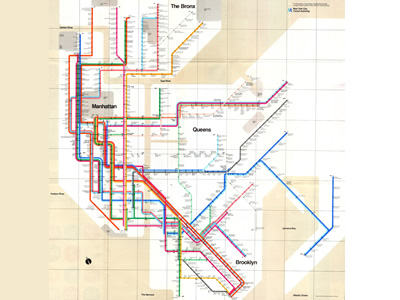 978 978 | 1972 computer graphics by Massimo Vignelli In 1972, the renowned Italian designer Massimo Vignelli redesigned George Salomon's New York Subway map, which persisted until 1979, when superseded by Michael Hertz's design. It was a marvelous conceptual map, and it was easy to read. It was a tool for navigating the subways, although not one for navigating the city streets. Out with the complicated tangle of geographically accurate train routes. No more messy angles. Instead, train lines would run at 45 and 90 angles only. Each line was represented by a color. Each stop represented by a dot. There was an obvious influence from the London Underground map, originally created by Harry Beck in 1933, however, Vignelli took it one step farther, in creating the now-famous intertwined wiring-diagram map of New York's vastly complicated subway lines. The result was a design solution of surprising beauty. However, Massimo Vignelli reached a level of abstraction that quickly ran into problems. To make the map work graphically meant that a few geographic liberties had to be taken. For instance, Vignelli's map represented Central Park as a square, when in fact it is three times as long as it is wide. It is said that Vignelli had planned a second, complementary map that would have been more tied to the actual above-ground geography, but the city never let him do it. |
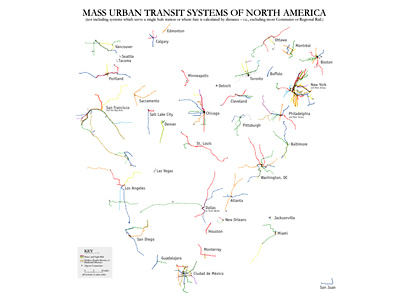 947 947 | 2005 computer graphics by Bill Rankin This map, produced by Bill Rankin, illustrates all mass urban transit systems of North America in a single space, facilitating a quick overview and density comparison between subway systems of different cities. At a glance, many metros seem to be comparable in scale, but what separates New York from Baltimore is density: station-to-station distance, line overlap, and linkages. Most systems are organized as a hub with spokes; the two notable exceptions are New York and Mexico City, both of which are more like nets. The map doesn't include systems which serve a single hub station or where fare is calculated by distance. |
 979 979 | 2004 computer graphics by Eddie Jabbour Eddie Jabbour, Creative Director at Kick Design, New York, is a tireless advocate for a new map design and communication solution for the world's most complex subway system. The NYC subway is indeed a challenge by itself. It has the biggest number of stations in the world (468), the second longest network and it's seventh in daily passenger numbers. But that didn't seem to intimidate Eddie Jabbour, who has produced a truly impressive proposal for redesigning the New York City subway map. He has made it easier to see all the different lines and made it clearer to identify the stations. The new map has not yet been released in totality, but Kick Design has put some samples out, which look exciting. |
 965 965 | 2003 computer graphics by bdcconseil The Paris Metro was originally known as the "Chemin de Fer Metropolitain" ("Metropolitan railway"), then "Metropolitain," quickly abbreviated to "Metro". Inaugurated in 1900, it is one of the oldest subway systems in the world, and the second biggest in number of stations, right next to New York City. The system consists of 16 lines, identified by numbers from 1 to 14, with two minor lines 3bis and 7bis, numbered thus because they are branch lines split off from their respective original lines. The Paris Metro network has 221.6 km (137.7 miles) of track and 380 stations (87 offering connection between lines). Most of the network was built from 1900 to 1939. After the war, most extension focused on the RER, a metropolitan express subway system. The images shown here are representative of the latest re-design of the Metro map, produced by the design agency bdcconseil (http://www.bdcconseil.com) in 2003. Click here to see the Paris metro network pictured at a geographically accurate scale. |
 1035 1035 | 2006 computer graphics by Tommy McCall Part of a series of Executive Compensation Tables by The New York Times, this impressive chart produced by Tommy McCall, titled "Pay for Performance? Sometimes, but Not Always", shows how chief executive pay changed against the shareholder return. At many companies, changes in chief executives' pay roughly corresponded with changes in their shareholders' total return in the year 2005. Several exceptions were in favor of shareholders, but most of the outliers favored CEO's. Part of the same series is an Interactive Graphic showing Executive pay statistics for 2005. Source: Pearl Meyer & Partners. |
 102 102 | 1873 print by R. A. Fisher, c.1955, after Josiah Willard Gibbs (1839-1903), USA Graphical methods applied to explain fundamental relations in thermodynamics; this includes diagrams of entropy vs. temperature (where work or heat is proportional to area), and the first use of trilinear coordinates (graphs of (x,y,z) where x+y+z=constant). Bumstead, H. A. (ed.) (1961). The Scientific Papers of J. Willard Gibbs . New York: Dover Publications, Inc. (an unabridged republication of the work originally published by Longmans, Green and Company in 1906). Gibbs, J. W. (1873). Graphical methods in the thermodynamics of fluids. Transactions of the Connecticut Academy of Arts and Sciences, 2:309-342. Reprinted in Bumstead (above). Gibbs, J. W. (1873). A method of geometrical representation of the thermodynamic properties of substances by means of surfaces. Transactions of the Connecticut Academy of Arts and Sciences, 2:382-404. Reprinted in Bumstead (above). |
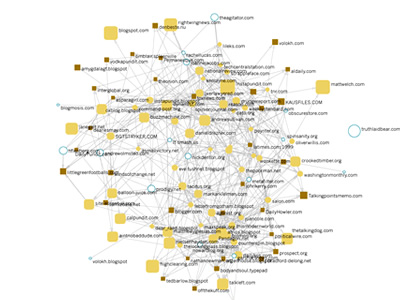 875 875 | 2004 computer graphics by Jodi Dean, Zachary Devereaux and The Govcom.org Foundation, an Amsterdam-based organization dedicated to creating and hosting political tools on the Web, and its collaborators have developed a software tool that locates and visualizes networks on the Web. The Issue Crawler, at http://issuecrawler.net, is used by NGOs and other researchers to answer questions about specific networks and effective networking more generally. One may also do in-depth research with the software. This image represents the entangled network of the most popular political blogs on the net. The graph build with Issue Crawler was produced by John Hawkin for issuenetwork.org (the workshop site by the Govcom.org Foundation), using a list available at rightwingnews.com that can be seen here. Source: News about Networks, workshop by the Govcom.org Foundation, de Balie Center for Culture and Politics, Amsterdam, 21-24 June 2004, with support from the Ford Foundation, New York, (http://www.issuenetwork.org/node.php?id=47). |
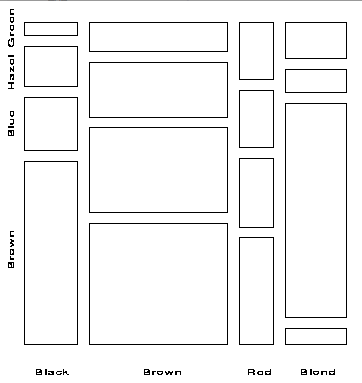
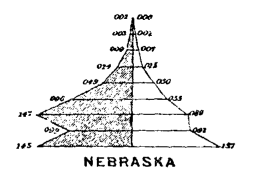 89 89 | 1874 print by Francis Amasa Walker (Superintendent of U.S. Census) (1840-1897), USA Age pyramid (bilateral histogram), bilateral frequency polygon, and the use of subdivided squares to show the division of population by two variables jointly (an early mosaic display) in the first true U.S. national statistical atlas. Walker, F. A. (1874). Statistical Atlas of the United States, Based on the Results of Ninth Census, 1870, with Contributions from Many Eminent Men of Science and Several Departments of the [Federal] Government. New York: Julius Bien. |
 100 100 | 1863 print by William Stanley Jevons (1835-1882), England Semilogarithmic grid (showing percentage changes in commodities). Jevons, W. S. (1863). A serious fall in the value of gold ascertained, and its social effects set fourth. London. Jevons, W. S. ([1879] 1958). Graphical method. In Principles of Science: A Treatise on Logic and Scientific Method, pp. 492-496. New York: Dover, 3rd edn. First ed.: 1874; page numbers from 3rd Ed. Dover reprint (1958). |
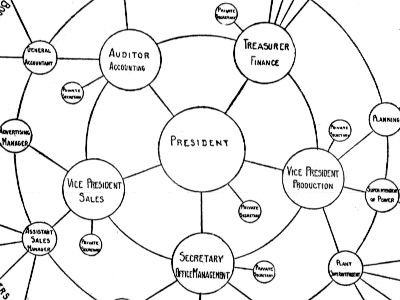 722 722 | 1924 computer graphics by (unknown) An impressive organization chart from 1924 with a clear emphasis on the central authority, which makes it difficult to ascertain the relations of the subordinate divisions. However, its radial structure has some interesting applications in many centralized (not to use the word authoritarian) systems. Source: W. H. Smith., Graphic Statistics in Management (McGraw-Hill Book Company, New York, ed. First, 1924) |
 236 236 | 1996 computer graphics by Aaron Walburg and Stephen Hartzog This version of Minard's Napolean's March, by Aaron Walburg and Stephen Hartzog, listed on the University of York History of Statistics page uses a real map of the region from Poland to Moscow as the background. It overlays on this an animated sequence showing the size of Napoleon's army (with dates), and the retreat, together with the decline of temperature. Static image: http://www.math.yorku.ca/SCS/Gallery/minard/march-animated.gif |
 637 637 | 2006 computer graphics (interactive) by Juliana Yamashita Each person constructs his/her image of the city. This image is made out of facts, memories, experiences, stories, news - mostly invisible data, and not only of architecture, buildings and streets. "SEARCHSCAPES: MANHATTAN" is an attempt to create a tridimensional map of Manhattan, using existing data from the web. The objective is to compare the city's "physical spaces" and "information spaces" (search results). This is an attempt to materialize information: to give it dimension and physicality. "SEARCHSCAPES: MANHATTAN" was developed as a thesis project at the Interactive Telecommunications Program at New York University. (The site requires Shockwave and Flash plug-ins) |
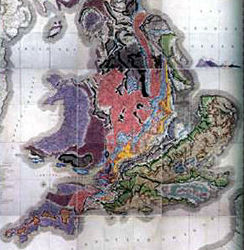 62 62 | 1801 print by William Smith (1769-1839), England The first large-scale geological map of England and Wales, setting the pattern for geological cartography, and founding stratigraphic geology. Recently called (hyperbolically) "the map that changed the world." (Smith's map was first drawn in 1801, but the final version was not published until 1815.) Smith, W. (Feb. 1815). A delineation of the strata of England and Wales, with part of Scotland; exhibiting the collieries and mines, the marshes and fenlands originally overflowed by the sea, and the varieties of soil according to the substrata, illustrated by the most descriptive names . London: John Cary. BL: Maps 1180.(19). Morton, J. L. (1992). Strata: How William Smith drew the First map of the Earth in 1801 and inspired the Science of Geology. Stroud, England: Tempus Publishing. ISBN 0 7524 1992. Winchester, S. (2001). The Map That Changed the World: William Smith and the Birth of Modern Geology. New York: Harper Collins. |
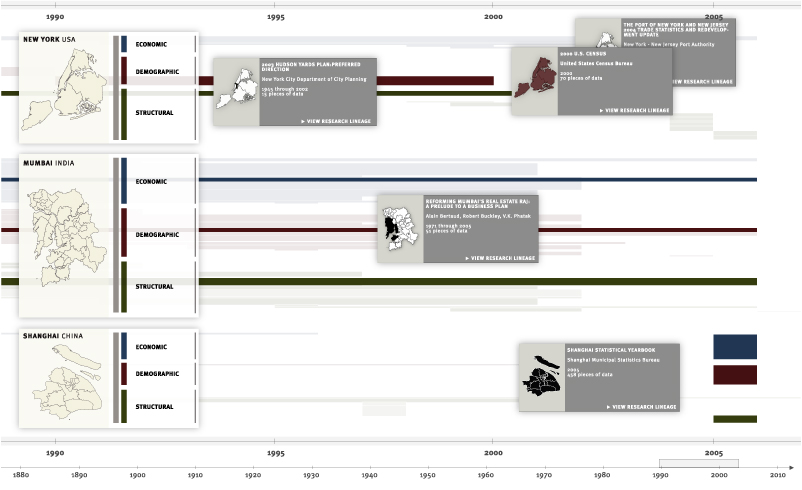
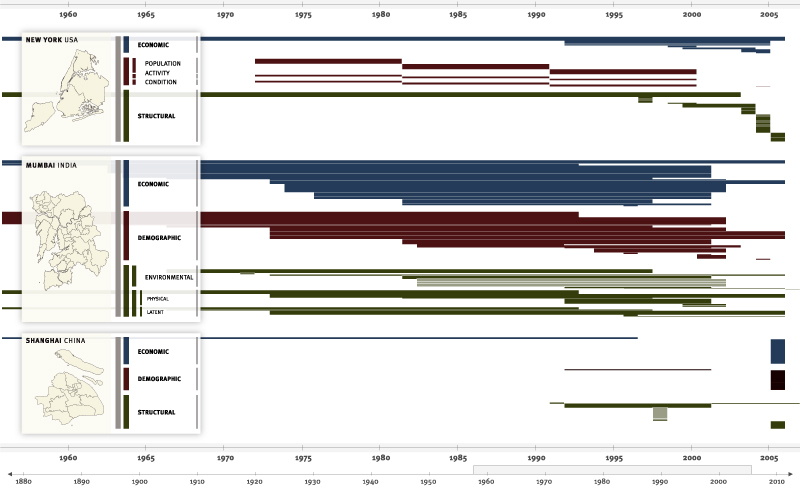 1218 1218 | 2006 computer graphics by Robert Pietrusko, Jamie Smith, and Sayoko Yoshida (PIIM) Data collected by researchers can be compared by region as well as by content. This visualization shows the buildup of economic, demographic and structural knowledge of Mumbai over a fifty-year period. Source Description Do We Know What We Don't Know? Source is a proposed software environment where a community of researchers will be able to contribute information at any temporal or spatial resolution, and at varying levels of detail and formality. The tool will highlight data that are consistent across datasets with regard to data format, resolution and availability. The tool will also highlight those aspects that remain incommensurable. Additionally, the researchers will be provided a set of visualization tools that will allow them to analyze and reason with both quantitative and qualitative information as well as gauge what areas of the information space are still poorly defined, thus fostering future work and data gathering. When applied to test case data about the cities of New York, Mumbai, and Shanghai, Source highlighted an abundance of data from Mumbai compared with the other two cities. This does not suggest there are more data for Mumbai than New York, but rather that the team of scholars were largely experts on Indian urban research and had not sufficiently built their knowledge base for a true comparative study. The tool made explicit and visually accessible how much of what kinds of data were available, exposing problems with the researchers' assumptions and intuitions. |
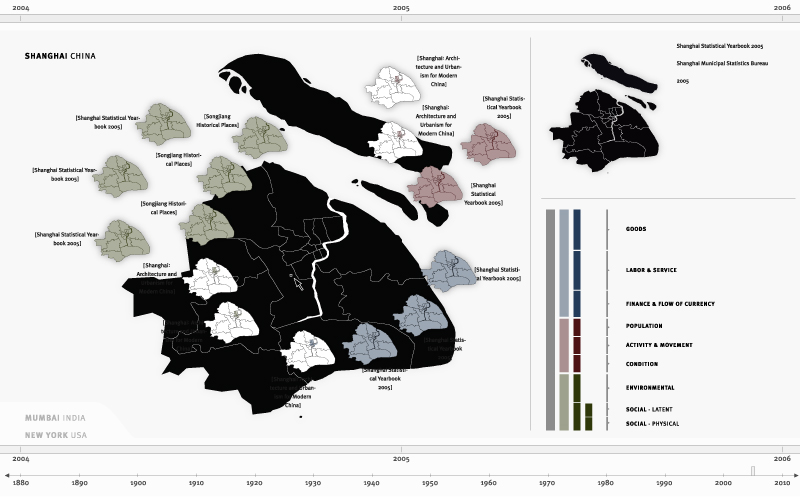 1217 1217 | 2006 computer graphics by Robert Pietrusko, Jamie Smith, and Sayoko Yoshida (PIIM) A geographic interface allows a researcher to inspect the scale and coverage of different data sources. By selecting any point on the map, the researcher would see each piece of data that covers the selected region. Source Description Do We Know What We Don't Know? Source is a proposed software environment where a community of researchers will be able to contribute information at any temporal or spatial resolution, and at varying levels of detail and formality. The tool will highlight data that are consistent across datasets with regard to data format, resolution and availability. The tool will also highlight those aspects that remain incommensurable. Additionally, the researchers will be provided a set of visualization tools that will allow them to analyze and reason with both quantitative and qualitative information as well as gauge what areas of the information space are still poorly defined, thus fostering future work and data gathering. When applied to test case data about the cities of New York, Mumbai, and Shanghai, Source highlighted an abundance of data from Mumbai compared with the other two cities. This does not suggest there are more data for Mumbai than New York, but rather that the team of scholars were largely experts on Indian urban research and had not sufficiently built their knowledge base for a true comparative study. The tool made explicit and visually accessible how much of what kinds of data were available, exposing problems with the researchers' assumptions and intuitions. |
 1219 1219 | 2006 computer graphics by Robert Pietrusko, Jamie Smith, and Sayoko Yoshida (PIIM) Data lines that come from the same source are highlighted. Multiple sources could be inspected simultaneously. Source Description Do We Know What We Don't Know? Source is a proposed software environment where a community of researchers will be able to contribute information at any temporal or spatial resolution, and at varying levels of detail and formality. The tool will highlight data that are consistent across datasets with regard to data format, resolution and availability. The tool will also highlight those aspects that remain incommensurable. Additionally, the researchers will be provided a set of visualization tools that will allow them to analyze and reason with both quantitative and qualitative information as well as gauge what areas of the information space are still poorly defined, thus fostering future work and data gathering. When applied to test case data about the cities of New York, Mumbai, and Shanghai, Source highlighted an abundance of data from Mumbai compared with the other two cities. This does not suggest there are more data for Mumbai than New York, but rather that the team of scholars were largely experts on Indian urban research and had not sufficiently built their knowledge base for a true comparative study. The tool made explicit and visually accessible how much of what kinds of data were available, exposing problems with the researchers' assumptions and intuitions. |
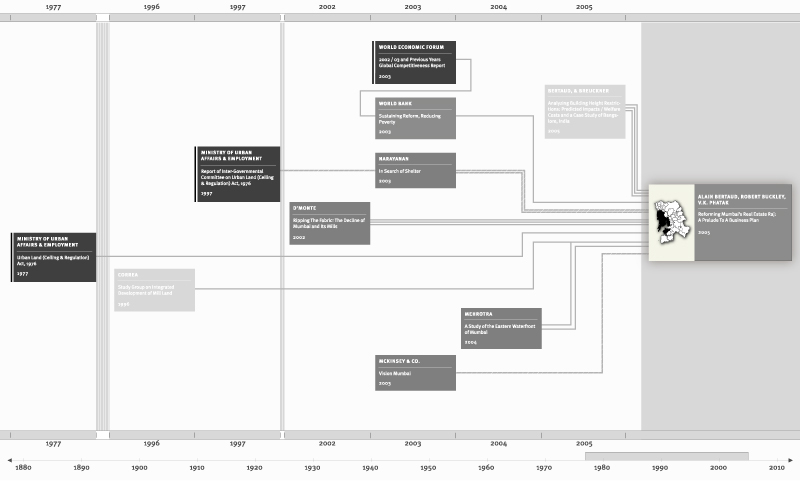 1216 1216 | 2006 computer graphics by Robert Pietrusko, Jamie Smith, and Sayoko Yoshida (PIIM) The Lineage View illustrates how documents are related through citation. Source Description Do We Know What We Don't Know? Source is a proposed software environment where a community of researchers will be able to contribute information at any temporal or spatial resolution, and at varying levels of detail and formality. The tool will highlight data that are consistent across datasets with regard to data format, resolution and availability. The tool will also highlight those aspects that remain incommensurable. Additionally, the researchers will be provided a set of visualization tools that will allow them to analyze and reason with both quantitative and qualitative information as well as gauge what areas of the information space are still poorly defined, thus fostering future work and data gathering. When applied to test case data about the cities of New York, Mumbai, and Shanghai, Source highlighted an abundance of data from Mumbai compared with the other two cities. This does not suggest there are more data for Mumbai than New York, but rather that the team of scholars were largely experts on Indian urban research and had not sufficiently built their knowledge base for a true comparative study. The tool made explicit and visually accessible how much of what kinds of data were available, exposing problems with the researchers' assumptions and intuitions. |
| | 2002 print by New York Times Sometimes a map wants to be the forground rather than the background for a data display. Anamorphic maps deform the map for this purpose,This map from the New York Times shows the state of the U.S. presidential race from polls conducted before the 2000 election. In order to show the contribution of each state to a victory by Bush or Gore, each state is sized according to the number of votes it has in the Electoral College, with one square for each vote. A 5-level color scale distinguishes 'safe' from 'leaning', and a bar graph at the bottom shows the totals for all states. Presented by Archie Tse in a session on Information Graphics at the 2002 Joint Statistical Meetings, Aug. 12, 2002. |
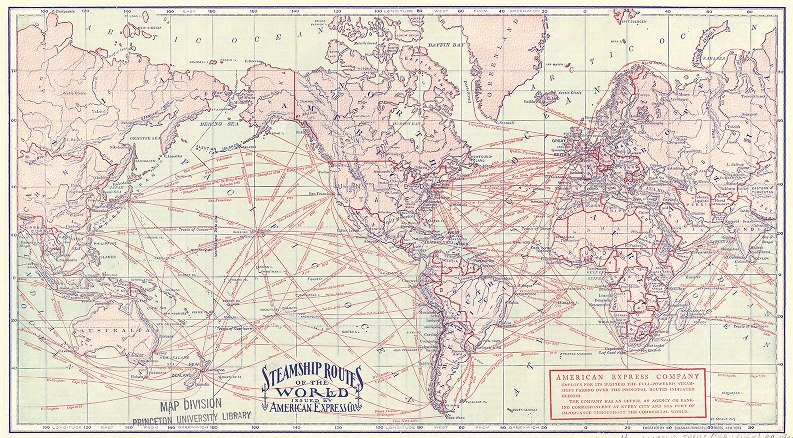 665 665 | 1900 by American Express Company, New York Title: Steamship Routes of the World issued by American Express Co. This image is derived from a high resolution version available at http://gisserver.princeton.edu/map/3324 Markings: "American Express Company" "Engraved by Chasmar-Winchell Press, New York." [edit] |
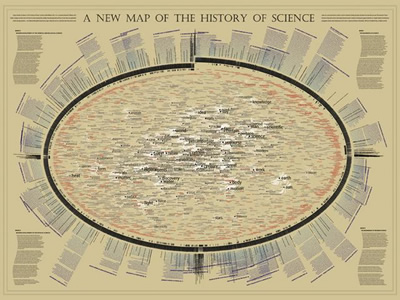 1034 1034 | 2006 computer graphics by W. Bradford Paley For the "Places & Spaces: Mapping Science" exhibition, W. Bradford Paley approached making a map of science indirectly, by making a map of a book describing The History of Science. In this way, he leveraged the intelligent organization by Henry Smith Williams (the history's author): this map was created more to take advantage of a culturally recognized way of organizing science than to invent a new one. The history's first two volumes are organized strictly historically, so as the book wraps around the right side of the ellipse it is organized as a time line. The next two volumes distinguish two major domains - making two time lines - for more recent scientific exploration: the physical sciences (along the bottom left) and the life sciences (top left). Since the scattered words are pulled toward the places where they are used in the text, structure emerges: names of individuals appear along the outside, as they are usually mentioned in only one or two places, and concepts that are common to science of all eras (e.g., system, theory, experiment) are pulled to the center, as they are mentioned everywhere. This map was on display at the NYPL Science, Industry, and Business Library, New York, as part of the "Places & Spaces: Mapping Science" exhibition, from April 3rd - August 31st, 2006. |
 318 318 | computer graphics by Mike Everett-Lane, Liz ?, and Matt Johnson Maps can be useful tools for cataloguing weblogs based on the location of the blogger. Here are three informative blog maps that make use of iconic subway maps for their respective cities to provide a strong visual template. This is a screenshot of the nyc bloggers subway map. http://www.nycbloggers.com/ From the website (June 2007): The idea is simple: A map of the city that shows where the bloggers are, organized by subway stop. Find out who's blogging in your neighborhood! You can click on the map to start exploring. The overview map will show you how many blogs are in each borough, and the borough maps will show you how many blogs are at each station. Click on the station to get the list of blogs. You can also browse by subway line, using the buttons on the right. And you can search for a specific blog by name using the search feature. |
 143 143 | 1991 computer graphics by Michael Friendly (1945-), Canada Mosaic display developed as a visual analysis tool for log-linear models (beginning general methods for visualizing categorical data). Friendly, M. and Fox, J. (Dec. 1991). Interpreting Higher Order Interactions in Loglinear Analysis: A Picture is Worth 1000 Words . Tech. rep., Institute for Social Research, York University, Toronto, CA. Friendly, M. (1994). Mosaic displays for multi-way contingency tables. Journal of the American Statistical Association, 89:190-200. |
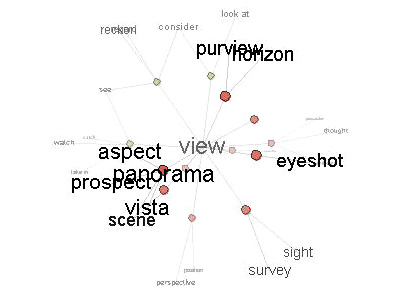 783 783 | 1998 computer graphics by (unknown) The Visual Thesaurus takes a unique, and remarkably beautiful approach to presenting the results of a word lookup. Discover and learn from nearly 40,000 words, meanings and relationships. Through its emphasis on exploration and vocabulary building, the Visual Thesaurus can improve reading, writing and communication skills. The New York Times: "Search for the word 'plain' in a conventional book-bound thesaurus, and you will find an unadorned and featureless list of synonyms on the printed page. Search for the same word with Visual Thesaurus 2.0, and the program generates an animated three-dimensional constellation in which 'plain' is at the center, surrounded by synonyms and other related words. Click on the antonym 'fancy' and that word drifts to middle of the screen, where synonyms rush to encircle it in an elaborate, showy and -- the people who came up with it hope -- thought-provoking display." |
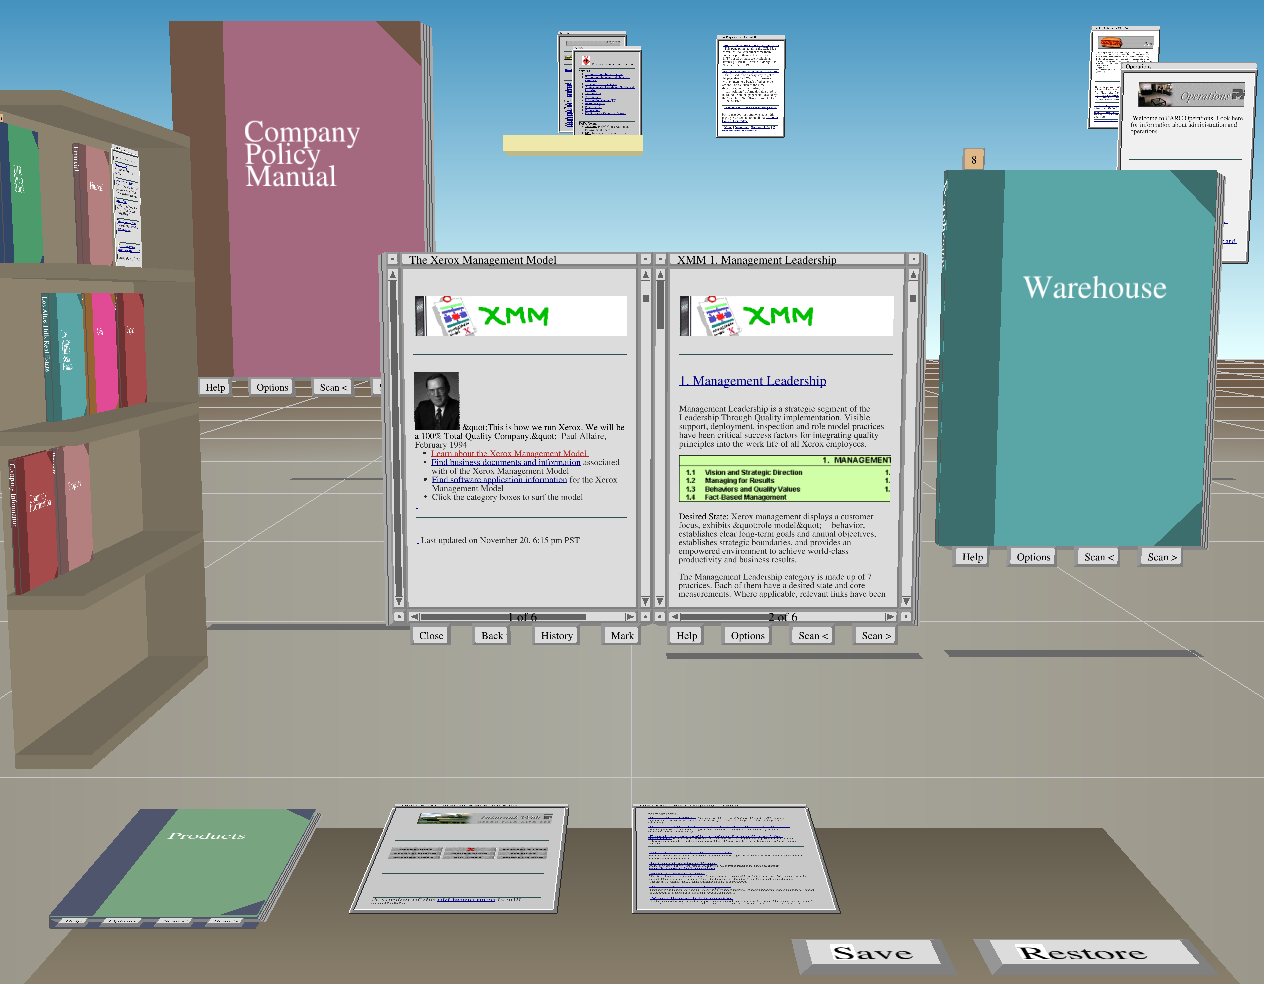 443 443 | 1996 computer graphics by Stuart Card, George Robertson and William York, at Xerox Palo Alto Research Center This is a 3D information workspace for interacting with the Web. It was a prototype. |